Using OEM debuggers
If you are exclusively writing Flutter apps with Dart code and not using platform-specific libraries, or otherwise accessing platform-specific features, you can debug your code using your IDE’s debugger. Only the first section of this guide, Debugging Dart code, is relevant for you.
If you’re writing a platform-specific plugin or using platform-specific libraries written in Swift, ObjectiveC, Java, or Kotlin, you can debug that portion of your code using Xcode (for iOS) or Android Gradle (for Android). This guide shows you how you can connect two debuggers to your Dart app, one for Dart, and one for the OEM code.
Debugging Dart code
Use your IDE for standard Dart debugging. These instructions describe Android Studio, but you can use your preferred IDE with the Flutter and Dart plugins installed and configured.
Dart debugger
Open your project in Android Studio. If you don’t have a project yet, create one using the instructions in Test drive.
Simultaneously bring up the Debug pane and run the app in the Console view by clicking the bug icon (
 ).
).The first time you launch the app is the slowest. You should see the Debug pane appear at the bottom of the window that looks something like the following:
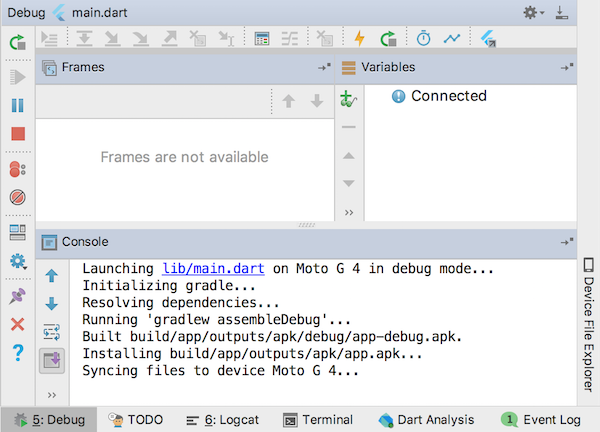
You can configure where the debug pane appears, or even tear it off to its own window using the gear to the right in the Debug pane bar. This is true for any inspector in Android Studio.
Add a breakpoint on the
counter++line.In the app, click the + button (FloatingActionButton, or FAB, for short) to increment the counter. The app pauses.
The following screenshot shows:
- Breakpoint in the edit pane.
- State of the app in the debug pane, when paused at the breakpoint.
thisvariable expanded to display its values.
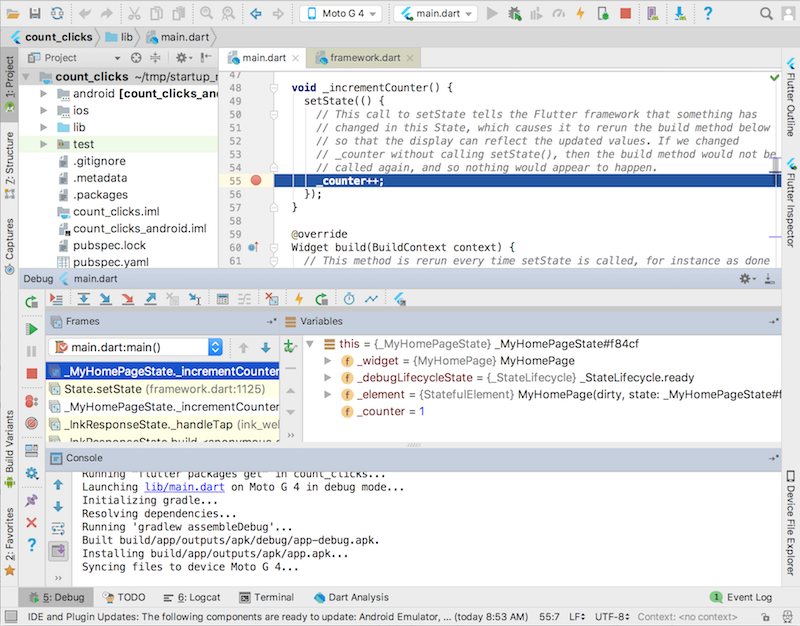
You can step in, out, and over Dart statements, hot reload or resume the app, and use the debugger in the same way you’d use any debugger. The 5: Debug button toggles display of the debug pane.
Flutter inspector
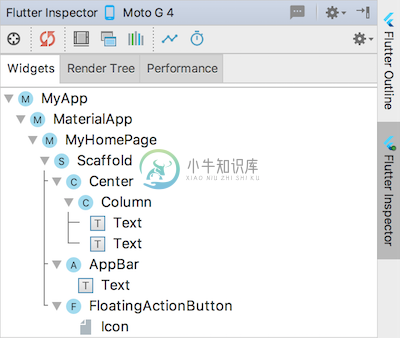
There are two other features provided by the Flutter plugin that you may find useful. The Flutter inspector is a tool for visualizing and exploring the Flutter widget tree and helps you:
- Understand existing layouts
- Diagnose layout issues
Toggle display of the inspector using the vertical button to the right of the Android Studio window.
Flutter outline
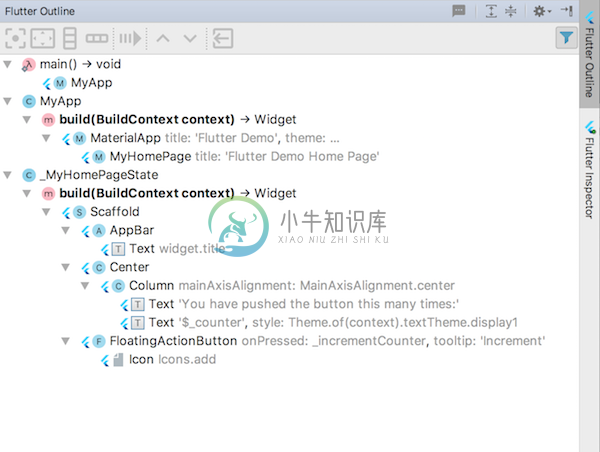
The Flutter Outline displays the build method in visual form. Note that this may be different than the widget tree for the build method. Toggle display of the outline using the vertical button to the right of the AS window.
The rest of this guide shows how to set up your environment to debug OEM code. As you’d expect, the process works differently for iOS and Android.
Debugging with Android Gradle (Android)
In order to debug OEM Android code, you need an app that contains OEM Android code. In this section, you’ll learn how to connect two debuggers to your app: 1) the Dart debugger and, 2) the Android Gradle debugger.
Create a basic Flutter app.
Replace
lib/main.dartwith the following example code from theurl_launcherpackage:
// Copyright 2017 The Chromium Authors. All rights reserved.
// Use of this source code is governed by a BSD-style license that can be
// found in the LICENSE file.

import 'dart:async';

import 'package:flutter/material.dart';
import 'package:url_launcher/url_launcher.dart';

void main() {
  runApp(MyApp());
}

class MyApp extends StatelessWidget {
  @override
  Widget build(BuildContext context) {
    return MaterialApp(
      title: 'URL Launcher',
      theme: ThemeData(
        primarySwatch: Colors.blue,
      ),
      home: MyHomePage(title: 'URL Launcher'),
    );
  }
}

class MyHomePage extends StatefulWidget {
  MyHomePage({Key key, this.title}) : super(key: key);
  final String title;

  @override
  _MyHomePageState createState() => _MyHomePageState();
}

class _MyHomePageState extends State<MyHomePage> {
  Future<void> _launched;

  Future<void> _launchInBrowser(String url) async {
    if (await canLaunch(url)) {
      await launch(url, forceSafariVC: false, forceWebView: false);
    } else {
      throw 'Could not launch $url';
    }
  }

  Future<void> _launchInWebViewOrVC(String url) async {
    if (await canLaunch(url)) {
      await launch(url, forceSafariVC: true, forceWebView: true);
    } else {
      throw 'Could not launch $url';
    }
  }

  Widget _launchStatus(BuildContext context, AsyncSnapshot<void> snapshot) {
    if (snapshot.hasError) {
      return Text('Error: ${snapshot.error}');
    } else {
      return Text('');
    }
  }

  @override
  Widget build(BuildContext context) {
    String toLaunch = 'https://flutter.io';
    return Scaffold(
      appBar: AppBar(
        title: Text(widget.title),
      ),
      body: Center(
        child: Column(
          mainAxisAlignment: MainAxisAlignment.center,
          children: <Widget>[
            Padding(
              padding: EdgeInsets.all(16.0),
              child: Text(toLaunch),
            ),
            RaisedButton(
              onPressed: () => setState(() {
                    _launched = _launchInBrowser(toLaunch);
                  }),
              child: Text('Launch in browser'),
            ),
            Padding(padding: EdgeInsets.all(16.0)),
            RaisedButton(
              onPressed: () => setState(() {
                    _launched = _launchInWebViewOrVC(toLaunch);
                  }),
              child: Text('Launch in app'),
            ),
            Padding(padding: EdgeInsets.all(16.0)),
            FutureBuilder<void>(future: _launched, builder: _launchStatus),
          ],
        ),
      ),
    );
  }
}- Add the
url_launcherdependency to the pubspec file, and run flutter packages get:
name: flutter_app
description: A new Flutter application.
version: 1.0.0+1

dependencies:
  flutter:
    sdk: flutter

  url_launcher: ^3.0.3
  cupertino_icons: ^0.1.2

dev_dependencies:
  flutter_test:
    sdk: flutter
Click the debug icon (
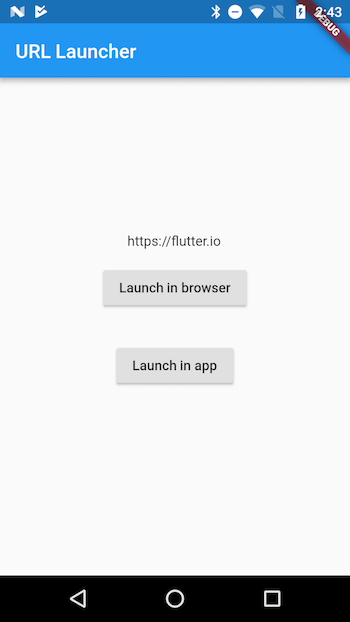
 ) to simultaneously bring up the Debug pane and launch the app. Wait for the app to launch on the device, and for the debug pane to indicate Connected. (This can take a minute the first time but is faster for subsequent launches.) The app contains two buttons: 1) Launch in browser opens flutter.io in your phone’s default browser and 2) Launch in app opens flutter.io within your app.
Click the Attach debugger to Android process button (
 )
)
From the process dialog, you should see an entry for each connected device. Select show all processes to display available processes for each device.
Choose the process you want to attach to. In this case, it’s the
com.google.clickcount(or com.company.app_name) process for the Motorola Moto G.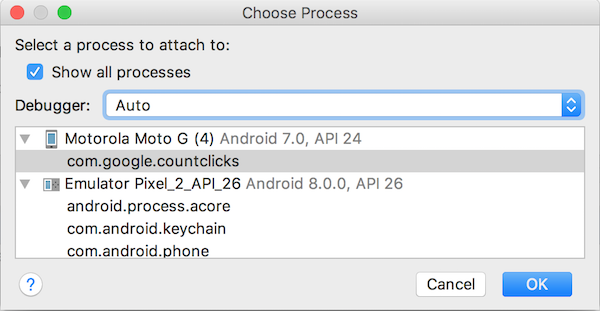
In the debug pane, you should now see a tab for Android Debugger.
In the project pane, expand app_name > android > app > src > main > java > io.flutter plugins. Double click GeneratedProjectRegistrant to open the Java code in the edit pane.
Both the Dart and OEM debuggers are interacting with the the same process. User either, or both, to set breakpoints, examine stack, resume execution… In other words, DEBUG!
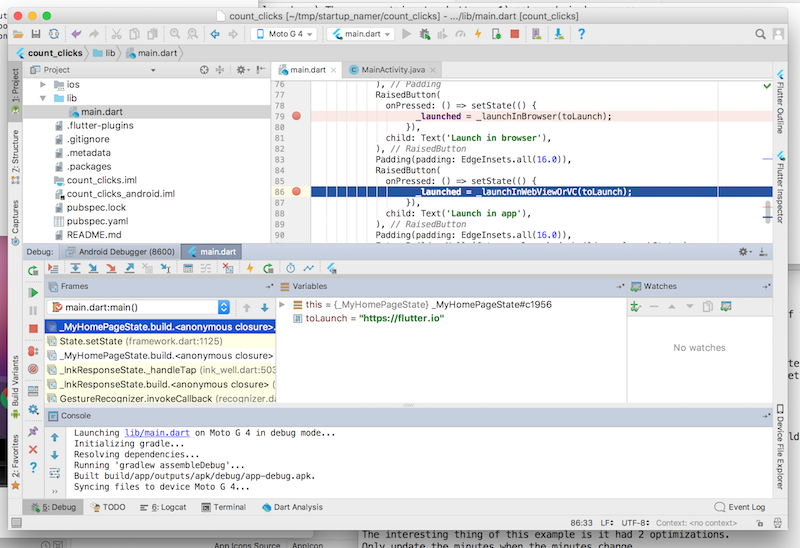 The Dart debug pane with two breakpoints set in
 lib/main.dart.
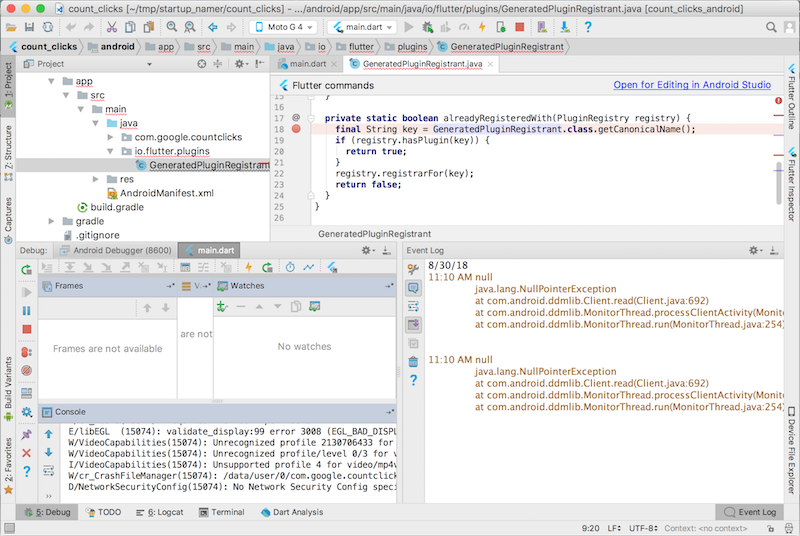 The Android debug pane with one breakpoint set in
 GeneratedPluginRegistrant.java. Toggle between the debuggers by clicking the appropriate debugger in the Debug pane’s banner.
Debugging with Xcode (iOS)
In order to debug OEM iOS code, you need an app that contains OEM iOS code. In this section, you’ll learn how to connect two debuggers to your app: 1) the Dart debugger and, 2) the Xcode debugger.
Resources
The following resources have more information on debugging Flutter, iOS, and Android:
Flutter
- Debugging Flutter Apps
- Advanced debugging, a section in Developing Flutter Apps in an IDE.
- Performance Profiling
Android
You can find the following debugging resources on developer.android.com.
iOS
You can find the following debugging resources on developer.apple.com.

