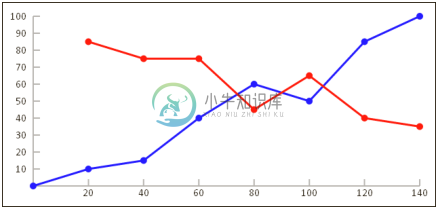
7.4 通过折线图标记数据点
如果你曾经上过科学课,你可能对根据一套实验数据生成折线图比较熟悉。在反映数据趋势时,折线图可能是最有用的数据可视化工具之一。本节,我们将创建一个可配置的折线图,它接受一个数据元素的数组,并在使用线段连接每个点的过程中,标记每个点。

操作步骤
按照以下步骤,创建一个Line Chart类,它能够根据一个数据的数组自动定位并设置折线图的尺寸:
1. 定义LineChart类的构造绘制,该函数绘制x轴和y轴:
function LineChart(config){
  //用户自定义属性
  this.canvas  = document.getElementById(config.canvasId);
  this.minX  = config.minX;
  this.minY  = config.minY;
  this.maxX  = config.maxX;
  this.maxY  = config.maxY;
  this.unitsPerTickX  = config.unitsPerTickX;
  this.unitsPerTickY  = config.unitsPerTickY;
  // constants
  this.padding  =  10;
  this.tickSize  =  10;
  this.axisColor  = "#555";
  this.pointRadius  =  5;
  this.font  = "12pt Calibri";
  /* 由于measureText没有提供文本高度的度量值
   * 所以,我们不得不通过硬编码来指定文本高度的值
   */
  this.fontHeight  =  12;
  // relationships
  this.context  = this.canvas.getContext("2d");
  this.rangeX  = this.maxX  - this.minY;
  this.rangeY  = this.maxY  - this.minY;
  this.numXTicks  = Math.round(this.rangeX  / this.unitsPerTickX);
  this.numYTicks  = Math.round(this.rangeY  / this.unitsPerTickY);
  this.x  = this.getLongestValueWidth()  + this.padding  *  2;
  this.y  = this.padding  *  2;
  this.width  = this.canvas.width  - this.x  - this.padding  *  2;
  this.height  = this.canvas.height  - this.y  - this.padding  -
  this.fontHeight;
  this.scaleX  = this.width  / this.rangeX;
  this.scaleY  = this.height  / this.rangeY;
  // draw x y axis and tick marks this.drawXAxis();
  this.drawYAxis();
}
2. 定义getLongestValueWidth()方法,该方法返回最长文本的像素宽度:
LineChart.prototype.getLongestValueWidth  = function(){
  this.context.font  = this.font;
  var longestValueWidth  =  0;
  for  (var n  =  0; n  <= this.numYTicks; n++)  {
    var value  = this.maxY  -  (n  * this.unitsPerTickY);
    longestValueWidth  = Math.max(longestValueWidth, this. context.measureText(value).width);
  }
  return longestValueWidth;
};
3. 定义drawXAxis()方法,该方法绘制x轴及其标签:
 LineChart.prototype.drawXAxis  = function(){
  var context  = this.context;
  context.save();
  context.beginPath();
  context.moveTo(this.x, this.y  + this.height);
  context.lineTo(this.x  + this.width, this.y  + this.height);
  context.strokeStyle  = this.axisColor;
  context.lineWidth  =  2;
  context.stroke();
  // draw tick marks
  for  (var n  =  0; n  < this.numXTicks; n++)  {
    context.beginPath();
    context.moveTo((n  +  1)  * this.width  / this.numXTicks  + this.x, this.y  + this.height);
    context.lineTo((n  +  1)  * this.width  / this.numXTicks  + this.x, this.y  + this.height  - this.tickSize);
    context.stroke();
  }
  // draw labels
  context.font  = this.font;
  context.fillStyle  = "black";
  context.textAlign  = "center";
  context.textBaseline  = "middle";
  for  (var n  =  0; n  < this.numXTicks; n++)  {
    var label  = Math.round((n  +  1)  * this.maxX  / this. numXTicks);
    context.save();
    context.translate((n  +  1)  * this.width  / this.numXTicks  + this.x, this.y  + this.height  + this.padding);
    context.fillText(label,  0,  0);
    context.restore();
  }
  context.restore();
};
4. 定义drawYAxis()方法,该方法绘制y轴及其标签:
 LineChart.prototype.drawYAxis  = function(){
  var context  = this.context;
  context.save();
  context.save();
  context.beginPath();
  context.moveTo(this.x, this.y);
  context.lineTo(this.x, this.y  + this.height);
  context.strokeStyle  = this.axisColor;
  context.lineWidth  =  2;
  context.stroke();
  context.restore();
  // draw tick marks
  for  (var n  =  0; n  < this.numYTicks; n++)  {
    context.beginPath();
    context.moveTo(this.x, n  * this.height  / this.numYTicks  +
    this.y);
    context.lineTo(this.x  + this.tickSize, n  * this.height  / this.numYTicks  + this.y);
    context.stroke();
  }
  // draw values
  context.font  = this.font;
  context.fillStyle  = "black";
  context.textAlign  = "right";
  context.textBaseline  = "middle";
  for  (var n  =  0; n  < this.numYTicks; n++)  {
    var value  = Math.round(this.maxY  - n  * this.maxY  / this. numYTicks);
    context.save();
    context.translate(this.x  - this.padding, n  * this.height  / this.numYTicks  + this.y);
    context.fillText(value,  0,  0); context.restore();
  }
  context.restore();
};
5. 定义drawLine()方法,该方法遍历数据点,并绘制线段来连接每个数据点:
LineChart.prototype.drawLine  = function(data, color, width){
  var context  = this.context;
  context.save();
  this.transformContext();
  context.lineWidth  = width;
  context.strokeStyle  = color; context.fillStyle  = color; context.beginPath();
  context.moveTo(data[0].x  * this.scaleX, data[0].y  * this. scaleY);
  for  (var n  =  0; n  < data.length; n++)  {
    var point  = data[n];
    // draw segment
    context.lineTo(point.x  * this.scaleX, point.y  * this. scaleY);
    context.stroke();
    context.closePath();
    context.beginPath();
    context.arc(point.x  * this.scaleX, point.y  * this.scaleY, this.pointRadius,  0,  2  * Math.PI, false);
    context.fill();
    context.closePath();
    // position for next segment context.beginPath();
    context.moveTo(point.x  * this.scaleX, point.y  * this. scaleY);
  }
  context.restore();
};
6. 定义transformContext()方法,该方法平移上下文,并在垂直方向上翻转上下文:
LineChart.prototype.transformContext  = function(){
  var context  = this.context;
  // move context to center of canvas
  this.context.translate(this.x, this.y  + this.height);
  // invert the y scale so that that increments
  // as you move upwards
  context.scale(1,  -1);
};
7. 页面加载完成后,实例化一个LineChart对象,创建蓝色折线的数据集,并使用drawLine()方法绘制该折线,再定义另一个红色折线的数据集,并绘制该折线:
window.onload  = function(){
  var myLineChart  = new LineChart({
    canvasId: "myCanvas",
    minX:  0,
    minY:  0,
    maxX:  140,
    maxY:  100,
    unitsPerTickX:  10,
    unitsPerTickY:  10
  });
  var data  =  [{
    x:  0,
    y:  0
  },  {
    x:  20,
    y:  10
  },  {
    x:  40,
    y:  15
  },  {
    x:  60,
    y:  40
  },  {
    x:  80,
    y:  60
  },  {
    x:  100,
    y:  50
  },  {
    x:  120,
    y:  85
  },  {
    x:  140,
    y:  100
  }];
  myLineChart.drawLine(data, "blue",  3);
  var data  =  [{
    x:  20,
    y:  85
  },  {
    x:  40,
    y:  75
  },  {
    x:  60,
    y:  75
  },  {
    x:  80,
    y:  45
  },  {
    x:  100,
    y:  65
  },  {
    x:  120,
    y:  40
  },  {
    x:  140,
    y:  35
  }];
  myLineChart.drawLine(data, "red",  3);
};
8. 在HTML文档的body部分嵌入canvas标签:
<canvas id="myCanvas" width="600" height="300" style="border:1px solid black;">
</canvas>
工作原理
开始,我们需要使用7个属性来配置LineChart对象,这些属性包括canvasId, minX, minY, maxX, maxY, unitsPerTickX和unitsPerTickY。LineChart。对象实例化完成后,我们将渲染x轴和y轴。
大多数有趣的事情发生在drawLine()方法中,该方法需要一个数据元素的数组,一个线条颜色,一个线条宽度参数。其工作原理如下:
1. 使用transformContext()方法平移、缩放、翻转上下文。
2. 调用moveTo()方法,把绘图光标定位到数据数组中的第一个数据点。
3. 遍历所有数据元素,从前一点到当前点绘制直线,然后,使用arc()方法,在当前点绘制一个小圆。
页面加载完成后,实例化一个LineChart对象,创建蓝色折线的数据点数组,并使用drawLine()方法绘制该折线,再定义另一个红色折线的数据点数组,并绘制该折线
相关参考
- 第1章 绘制直线
- 第2章 处理文本
- 第4章 平移画布上下文

