Apache poi Excel折线图点
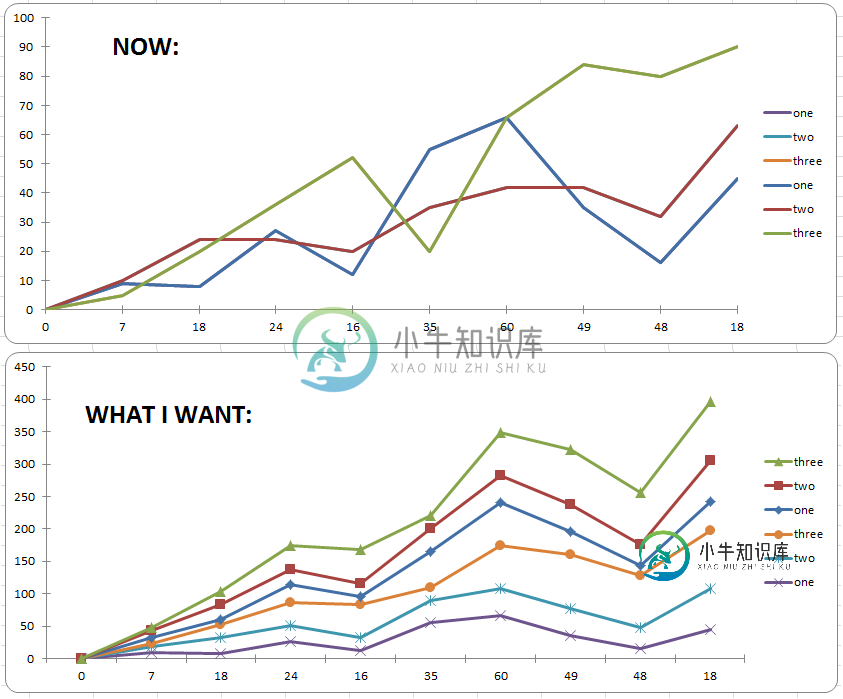
我正在创建一个带有折线图的Excel文件。我已经创建了图表并用数据填充了它,但我不能在我的图表上创建点。有没有人知道,有没有一种方法可以使用apache POI在图表中生成这些点(三角形、正方形、圆形等)?

这是我生成当前char的代码:
    public static void main(String[] args) throws Exception {
        Workbook wb = new XSSFWorkbook();
        Sheet dataSheet = wb.createSheet("linechart");

        final int NUM_OF_ROWS = 10;
        final int NUM_OF_COLUMNS = 4;

        Row row;
        Cell cell;
        for (int rowIndex = 0; rowIndex < NUM_OF_ROWS; rowIndex++) {
            row = dataSheet.createRow((short) rowIndex);
            for (int colIndex = 0; colIndex < NUM_OF_COLUMNS; colIndex++) {
                cell = row.createCell((short) colIndex);
                cell.setCellValue(rowIndex * ((colIndex + 1) + ((int) (Math.random() * 10))));
            }
        }

        Drawing drawing = dataSheet.createDrawingPatriarch();
        ClientAnchor anchor = drawing.createAnchor(0, 0, 0, 0, NUM_OF_COLUMNS + 2, 3, NUM_OF_COLUMNS + 15, 20);

        Chart chart = drawing.createChart(anchor);
        ChartLegend legend = chart.getOrCreateLegend();
        legend.setPosition(LegendPosition.RIGHT);

        LineChartData data = chart.getChartDataFactory().createLineChartData();

        ChartAxis bottomAxis = chart.getChartAxisFactory().createCategoryAxis(AxisPosition.BOTTOM);
        ValueAxis leftAxis = chart.getChartAxisFactory().createValueAxis(AxisPosition.LEFT);
        leftAxis.setCrosses(AxisCrosses.AUTO_ZERO);

        ChartDataSource<Number> xs = DataSources.fromNumericCellRange(dataSheet, new CellRangeAddress(0, NUM_OF_ROWS - 1, 0, 0));
        ChartDataSource<Number> ys1 = DataSources.fromNumericCellRange(dataSheet, new CellRangeAddress(0, NUM_OF_ROWS - 1, 1, 1));
        ChartDataSource<Number> ys2 = DataSources.fromNumericCellRange(dataSheet, new CellRangeAddress(0, NUM_OF_ROWS - 1, 2, 2));
        ChartDataSource<Number> ys3 = DataSources.fromNumericCellRange(dataSheet, new CellRangeAddress(0, NUM_OF_ROWS - 1, 3, 3));

        LineChartSeries series1 = data.addSeries(xs, ys1);
        series1.setTitle("one");
        LineChartSeries series2 = data.addSeries(xs, ys2);
        series2.setTitle("two");
        LineChartSeries series3 = data.addSeries(xs, ys3);
        series3.setTitle("three");

        chart.plot(data, bottomAxis, leftAxis);

        XSSFChart xssfChart = (XSSFChart) chart;
        CTPlotArea plotArea = xssfChart.getCTChart().getPlotArea();
        plotArea.getLineChartArray()[0].getSmooth();
        CTBoolean ctBool = CTBoolean.Factory.newInstance();
        ctBool.setVal(false);
        plotArea.getLineChartArray()[0].setSmooth(ctBool);
        for (CTLineSer ser : plotArea.getLineChartArray()[0].getSerArray()) {
            ser.setSmooth(ctBool);
        }

        FileOutputStream fileOut = new FileOutputStream("chart.xlsx");
        wb.write(fileOut);
        fileOut.close();
    }
共有1个答案
解决方案:
CTPlotArea plotArea = xssfChart.getCTChart().getPlotArea();
CTMarker ctMarker = CTMarker.Factory.newInstance();
ctMarker.setSymbol(CTMarkerStyle.Factory.newInstance());
for (CTLineSer ser : plotArea.getLineChartArray()[0].getSerArray()) {
    ser.setMarker(ctMarker);
}
-
基本折线图 <template> <ve-line :data="chartData" :settings="chartSettings"></ve-line> </template> <script> export default { data () { this.chartSettings = {} return { chartData: { columns: ['日期',
-
实时显示传感器数据。 用法 Your browser does not support the video tag. 案例:数据变化趋势 功能:显示数字改变的规律
-
主要内容:绘制单条折线,绘制多条折线图折线图(line chart)是我们日常工作、学习中经常使用的一种图表,它可以直观的反映数据的变化趋势。与绘制柱状图、饼状图等图形不同,Matplotlib 并没有直接提供绘制折线图的函数,因此本节着重讲解如何绘制一幅折线图。 绘制单条折线 下面示例是关于 小牛知识库用户活跃度的折线图: 显示结果如下: 绘制多条折线图 当学习完如何绘制单条折线的绘制后,再绘制多条折线也变的容易,只要准备好绘制多条
-
折线图可以比较不同时期的数据。使用一系列点创建折线图。这些点代表每个时期的度量值。 度量和维度采用折线图中图表区域的两个轴。每次观察的这对值成为一个点。在加入所有这些点之后,将成为显示维度和度量之间变化的线。 创建折线图的过程将在下面逐步显示: 例如,考虑一个数据源:Sample-Superstore及其维度和度量。 第1步:选择一个维度和一个度量来创建简单的折线图。 1)将维度订单日期拖到列架中
-
主要内容:什么是JFreeChart 折线图,JFreeChart 折线图的示例什么是JFreeChart 折线图 折线图是由直线段连接的一系列点。信息通过这些连接线显示。折线图表示数据如何以相同的时间频率变化。 下图显示了 JFreeChart 库中包含的折线图的一些演示版本: JFreeChart 折线图的示例 让我们考虑一个示例数据,它显示了我们网站www.xnip.cn上的流量数据。 日期 每日访客人数 2016-12-19 200 2016-12-20 150 20
-
一个折线图加坐标图的demo,点击数据点,弹出一个标有数据的小视图。 开发者@挺风和日丽的啊说:工作需要,做了个简单的折线图DEMO,大家别鄙视我就好,代码未完善,需要的话可以自己改改。 [Code4App.com]
-
折线图用于绘制基于线/样条的图表。在本节中,我们将讨论不同类型的基于折线和样条的图表。 图表类型 描述 基本折线图 基本折线图 带数据标签的折线图 带数据标签的折线图 时间序列可缩放的折线图 时间序列可缩放的折线图 带倒轴样式曲线的折线图 带倒轴样式曲线的折线图 带符号的折线图 带符号的折线图 带绘图带的折线图 带绘图带的折线图
-
折线图是在一条线上绘制数据点的展现方式。通常用于显示趋势数据或两个数据集的比较。 new Chart(document.getElementById("chartjs-0"),{"type":"line","data":{"labels":["January","February","March","April","May","June","July"],"datasets":[{"label":

