7.2 创建柱状图
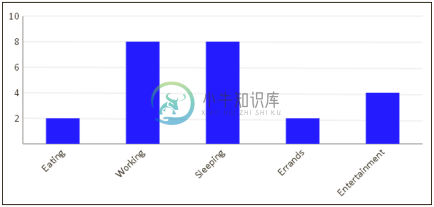
紧跟在饼图之后,柱状图是另外一个流行的数据可视化工具。本节,我们将创建一个可配置的Bar Chart类,它接受一个数据元素的数组,并生成一个简单的柱状图。我们将复用上一节的数据结构来比较其结果。跟Pie Chart类似,柱状图也尽可能自动填满整个画布。

操作步骤
按照以下步,骤创建Bar Chart类,它根据一个数据的数组创建柱状图,并能够自动定位并设置柱状图和图例的尺寸:1. 定义BarChart类的构造函数,来绘制柱状图:
/* BarChart类的构造函数 */
function BarChart(config){
  // 用户自定义属性
  this.canvas  = document.getElementById(config.canvasId);
  this.data  = config.data;
  this.color  = config.color;
  this.barWidth  = config.barWidth;
  this.gridLineIncrement  = config.gridLineIncrement;
  /*  把最大值调整为能被网格的增量整除的最大可能值,且小于请求的最大值 */
  this.maxValue  = config.maxValue  - Math.floor(config.maxValue  % this.gridLineIncrement);
  this.minValue  = config.minValue;
  //常量定义
  this.font  = "12pt Calibri";
  this.axisColor  = "#555";
  this.gridColor  = "#aaa";
  this.padding  =  10;
  //关系定义
  this.context  = this.canvas.getContext("2d");
  this.range  = this.maxValue  - this.minValue;
  this.numGridLines  = this.numGridLines  = Math.round(this.range / this.gridLineIncrement);
  this.longestValueWidth  = this.getLongestValueWidth();
  this.x  = this.padding  + this.longestValueWidth;
  this.y  = this.padding  *  2;
  this.width  = this.canvas.width  -  (this.longestValueWidth  + this.padding  *  2);
  this.height  = this.canvas.height  -  (this.getLabelAreaHeight() + this.padding  *  4);
  //绘制柱状图
  this.drawGridlines();
  this.drawYAxis();
  this.drawXAxis();
  this.drawBars();
  this.drawYVAlues();
  this.drawXLabels();
}
2. 定义getLabelAreaHeight()方法,该方法决定标签区域的高度(标签位于x轴的下方):
/* 通过找出标签的最大宽度,并用三角函数计算出其投影高度(因为标签文本会被旋转45°),来获取标签高度 */
BarChart.prototype.getLabelAreaHeight  = function(){
  this.context.font  = this.font;
  var maxLabelWidth  =  0;
  /*
   * 遍历所有标签并确定哪个标签是最长的,使用该信息来决定标签的宽度
   */
  for  (var n  =  0; n  < this.data.length; n++)  {
    var label  = this.data[n].label;
    maxLabelWidth  = Math.max(maxLabelWidth, this.context. measureText(label).width);
  }
  /*返回 labelWidth 的 y 分量,labelWidth 在45°角的方向上
   *
   * a^2  + b^2  = c^2
   * a  = b
   * c  = labelWidth
   * a  = 直角三角形的高度分量
   * 解出a
  */
  return Math.round(maxLabelWidth  / Math.sqrt(2));
};
3. 定义getLongestValueWidth()方法,该方法返回最长的文本宽度:
BarChart.prototype.getLongestValueWidth  = function(){
  this.context.font  = this.font;
  var longestValueWidth  =  0;
  for  (var n  =  0; n  <= this.numGridLines; n++)  {
    var value  = this.maxValue  -  (n  * this.gridLineIncrement);
    longestValueWidth  = Math.max(longestValueWidth, this.context.measureText(value).width);
  }
  return longestValueWidth;
};
4. 定义drawXLabels()方法,该方法绘制x轴标签:
 BarChart.prototype.drawXLabels  = function(){
  var context  = this.context;
  context.save();
  var data  = this.data;
  var barSpacing  = this.width  / data.length;
  for  (var n  =  0; n  < data.length; n++)  {
    var label  = data[n].label; context.save();
    context.translate(this.x  +  ((n  +  1  /  2)  * barSpacing), this.y  + this.height  +  10);
    context.rotate(-1  * Math.PI  /  4);   // 旋转45°
    context.font  = this.font;
    context.fillStyle  = "black";
    context.textAlign  = "right";
    context.textBaseline  = "middle";
    context.fillText(label,  0,  0);
    context.restore();
  }
  context.restore();
};
5. 定义drawYValues()方法,该方法绘制y轴的值:
 BarChart.prototype.drawYVAlues  = function(){
  var context  = this.context;
  context.save();
  context.font  = this.font;
  context.fillStyle  = "black";
  context.textAlign  = "right";
  context.textBaseline  = "middle";
  for  (var n  =  0; n  <= this.numGridLines; n++)  {
    var value  = this.maxValue  -  (n  * this.gridLineIncrement);
    var thisY  =  (n  * this.height  / this.numGridLines)  +  this.y;
    context.fillText(value, this.x  -  5, thisY);
  }
  context.restore();
};
6. 定义drawBars()方法,该方法遍历所有数据元素,并为每个元素绘制一根柱子:
BarChart.prototype.drawBars  = function(){
  var context  = this.context;
  context.save();
  var data  = this.data;
  var barSpacing  = this.width  / data.length;
  var unitHeight  = this.height  / this.range;
  for  (var n  =  0; n  < data.length; n++)  {
    var bar  = data[n];
    var barHeight  =  (data[n].value  - this.minValue)  * unitHeight;
    /* 如果柱子的高度小于0,意味着其值小于最小值。
     * 由于我们不想在x轴的下方绘制柱子,所以,只绘制高度大于0的柱子
     */
    if  (barHeight  >  0)  {
      context.save();
      context.translate(Math.round(this.x + ((n + 1 / 2) * barSpacing)), Math.round(this.y + this.height));
      /* 为了方便,我们可以绘制以x轴为起点、颠倒的柱子,
       * 然后使用scale(1,  -1)把它翻转到正确的方向。
       * 这是变换有助于减少计算的很好的例子
       */
      context.scale(1,  -1);
      context.beginPath();
      context.rect(-this.barWidth  /  2,  0, this.barWidth,
      barHeight);
      context.fillStyle  = this.color;
      context.fill();
      context.restore();
    }
  }
  context.restore();
};
7. 定义drawGridlines()方法,该方法绘制柱状图上的水平网格线:
BarChart.prototype.drawGridlines  = function(){
  var context  = this.context;
  context.save();
  context.strokeStyle  = this.gridColor;
  context.lineWidth  =  2;
  // 绘制y轴网格线
  for  (var n  =  0; n  < this.numGridLines; n++)  {
    var y  =  (n  * this.height  / this.numGridLines)  + this.y;
    context.beginPath();
    context.moveTo(this.x, y);
    context.lineTo(this.x  + this.width, y);
    context.stroke();
  }
  context.restore();
};
8. 定义drawXAxis()方法,该方法绘制x轴:
 BarChart.prototype.drawXAxis  = function(){
  var context  = this.context;
  context.save();
  context.beginPath();
  context.moveTo(this.x, this.y  + this.height);
  context.lineTo(this.x  + this.width, this.y  + this.height);
  context.strokeStyle  = this.axisColor;
  context.lineWidth  =  2;
  context.stroke();
  context.restore();
};
9. 定义drawYAxis()方法,该方法绘制y轴:
BarChart.prototype.drawYAxis  = function(){
  var context  = this.context;
  context.save();
  context.beginPath();
  context.moveTo(this.x, this.y);
  context.lineTo(this.x, this.height  + this.y);
  context.strokeStyle  = this.axisColor;
  context.lineWidth  =  2;
  context.stroke();
  context.restore();
};
10. 页面加载完成后,构建数据,并实例化一个BarChart对象:
window.onload  = function(){
  var data  =  [{
    label: "Eating",
    value:  2
  },  {
    label: "Working",
    value:  8
  },  {
    label: "Sleeping",
    value:  8
  },  {
    label: "Errands",
    value:  2
  },  {
    label: "Entertainment",
    value:  4
  }];
  new BarChart({
    canvasId: "myCanvas",
    data: data,
    color: "blue",
    barWidth:  50,
    minValue:  0,
    maxValue:  10,
    gridLineIncrement:  2
  });
};
11. 在HTML文档的body部分嵌入canvas标签:
<canvas id="myCanvas" width="600" height="300" style="border:1px solid black;">
</canvas>
工作原理
与饼图相比,为了使柱状图变得真正通用,它需要多一点配置。实现BarChart类,我们需要传递画布ID、一个数据元素的数组、柱子颜色、柱子宽度、网格线的增量(网格线之间的单位的数目)、最大值和最小值。BarChart构造函数使用6个方法来渲染柱状图,它们分别是drawGridlines(),drawYAxis(),drawXAxis(),drawBars(),drawYValues(), drawXLabels()。
BarChart类的关键是drawBars()方法,该方法迭代所有的数据元素,再针对每个数据元素,绘制一个矩形。绘制每个柱子的最简单方法是,先把上下文转换为垂直方向(以便正的y值是向上的,而不是向下的),把绘制光标定位到x轴,再绘制一个向下的矩形,矩形的高度等于数据元素的值。因为上下文在垂直方向上是颠倒的,于是,柱子就会向上直立。
相关参考
- 第1章 处理文本
- 第2章 绘制矩形
- 第4章 平移画布上下文
- 第4章 旋转画布上下文
- 第4章 创建镜像变换

