7.3 根据方程式绘制图形
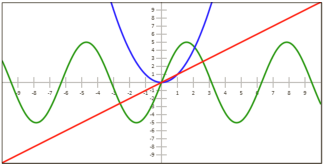
本节,我们将创建一个可配置的Graph类,该类可以绘制带有刻度线及刻度值的x轴和y轴,再构造一个drawEquation()方法,该方法允许我们绘制f(x)函数的曲线图。我们将实例化一个Graph对象,并绘制一条正弦波,一条抛物线方程,和一条直线方程。

操作步骤
按照以下步骤,创建一个Graph类,该类既能绘制带有刻度线及刻度值的x轴和y轴,也能绘制f(x)函数的曲线图:
1. 定义Graph类的构造函数,该函数绘制x轴和y轴:
function Graph(config){
  //用户自定义属性
  this.canvas  = document.getElementById(config.canvasId);
  this.minX  = config.minX;
  this.minY  = config.minY;
  this.maxX  = config.maxX;
  this.maxY  = config.maxY;
  this.unitsPerTick  = config.unitsPerTick;
  // 常量
  this.axisColor  = "#aaa";
  this.font  = "8pt Calibri"; this.tickSize  =  20;
  //关系
  this.context  = this.canvas.getContext("2d");
  this.rangeX  = this.maxX  - this.minX;
  this.rangeY  = this.maxY  - this.minY;
  this.unitX  = this.canvas.width  / this.rangeX;
  this.unitY  = this.canvas.height  / this.rangeY;
  this.centerY  = Math.round(Math.abs(this.minY  / this.rangeY)  * this.canvas.height);
  this.centerX  = Math.round(Math.abs(this.minX  / this.rangeX)  * this.canvas.width);
  this.iteration =  (this.maxX  - this.minX)  /  1000;
  this.scaleX  = this.canvas.width  / this.rangeX;
  this.scaleY  = this.canvas.height  / this.rangeY;
  //绘制x轴和y轴
  this.drawXAxis();
  this.drawYAxis();
}
2. 定义drawXAxis()方法,该方法绘制x轴:
Graph.prototype.drawXAxis  = function(){
  var context  = this.context;
  context.save();
  context.beginPath();
  context.moveTo(0, this.centerY);
  context.lineTo(this.canvas.width, this.centerY);
  context.strokeStyle  = this.axisColor;
  context.lineWidth  =  2;
  context.stroke();
  // 绘制刻度线
  var xPosIncrement  = this.unitsPerTick  * this.unitX;
  var xPos, unit;
  context.font  = this.font;
  context.textAlign  = "center";
  context.textBaseline  = "top";
  //绘制左侧刻度线
  xPos  = this.centerX  - xPosIncrement;
  unit  =  -1  * this.unitsPerTick;
  while  (xPos  >  0)  {
    context.moveTo(xPos, this.centerY  - this.tickSize  /  2);
    context.lineTo(xPos, this.centerY  + this.tickSize  /  2);
    context.stroke();
    context.fillText(unit, xPos, this.centerY  + this.tickSize /  2  +  3);
    unit  -= this.unitsPerTick;
    xPos  = Math.round(xPos  - xPosIncrement);
  }
  //绘制右侧刻度线
  xPos  = this.centerX  + xPosIncrement;
  unit  = this.unitsPerTick;
  while  (xPos  < this.canvas.width)  {
    context.moveTo(xPos, this.centerY  - this.tickSize  /  2);
    context.lineTo(xPos, this.centerY  + this.tickSize  /  2);
    context.stroke();
    context.fillText(unit, xPos, this.centerY  + this.tickSize /  2  +  3);
    unit  += this.unitsPerTick;
    xPos  = Math.round(xPos  + xPosIncrement);
  }
  context.restore();
};
3. 定义drawYAxis()方法,该方法绘制y轴:
Graph.prototype.drawYAxis  = function(){
  var context  = this.context;
  context.save();
  context.beginPath();
  context.moveTo(this.centerX,  0);
  context.lineTo(this.centerX,
  this.canvas.height);
  context.strokeStyle  = this.axisColor;
  context.lineWidth  =  2;
  context.stroke();
  //绘制刻度线
  var yPosIncrement  = this.unitsPerTick  * this.unitY;
  var yPos, unit;
  context.font  = this.font;
  context.textAlign  = "right";
  context.textBaseline  = "middle";
  //绘制顶部刻度线
  yPos  = this.centerY  - yPosIncrement;
  unit  = this.unitsPerTick;
  while  (yPos  >  0)  {
    context.moveTo(this.centerX  - this.tickSize  /  2, yPos);
    context.lineTo(this.centerX  + this.tickSize  /  2, yPos);
    context.stroke();
    context.fillText(unit, this.centerX - this.tickSize / 2 - 3, yPos);
    unit  += this.unitsPerTick;
    yPos  = Math.round(yPos  - yPosIncrement);
  }
  //绘制底部刻度线
  yPos  = this.centerY  + yPosIncrement;
  unit  =  -1  * this.unitsPerTick;
  while  (yPos  < this.canvas.height)  {
    context.moveTo(this.centerX  - this.tickSize  /  2, yPos);
    context.lineTo(this.centerX  + this.tickSize  /  2, yPos);
    context.stroke();
    context.fillText(unit, this.centerX - this.tickSize / 2 - 3, yPos);
    unit  -= this.unitsPerTick;
    yPos  = Math.round(yPos  + yPosIncrement);
  }
  context.restore();
};
4. 调用drawEquation()方法,该方法接受一个函数f(x)参数,然后,通过从minX到maxX循遍历x值来绘制该方程:
Graph.prototype.drawEquation  = function(equation, color, thickness){
  var context  = this.context; context.save();
  context.save();
  this.transformContext();
  context.beginPath();
  context.moveTo(this.minX, equation(this.minX));
  for  (var x = this.minX + this.iteration; x <= this.maxX; x += this.iteration)  {
    context.lineTo(x, equation(x));
  }
  context.restore();
  context.lineJoin  = "round";
  context.lineWidth  = thickness;
  context.strokeStyle  = color;
  context.stroke();
  context.restore();
};
5. 定义transformContext()方法,该方法把上下文平移到图形的中央,拉伸图形以适应画布,然后翻转y轴:
Graph.prototype.transformContext  = function(){
  var context  = this.context;
  //把上下文平移到画布中央
  this.context.translate(this.centerX, this.centerY);
  /* 拉伸网格以适应画布,并翻转y轴,
   * 以便y轴刻度值沿向上方向依次递增
   */
  context.scale(this.scaleX,  -this.scaleY);
};
6. 页面加载完成后,实例化一个Graph对象,然后调用drawEquation()方法绘制三个方程:
window.onload  = function(){
  var myGraph  = new Graph({
    canvasId: "myCanvas",
    minX:  -10,
    minY:  -10,
    maxX:  10,
    maxY:  10,
    unitsPerTick:  1
  });
  myGraph.drawEquation(function(x){
      return  5  * Math.sin(x);
  }, "green",  3);
  myGraph.drawEquation(function(x){
      return x  * x;
  }, "blue",  3);
  myGraph.drawEquation(function(x){
      return  1  * x;
  }, "red",  3);
};
7. 在HTML文档的body部分嵌入canvas标签:
<canvas id="myCanvas" width="600" height="300" style="border:1px solid black;">
</canvas>
工作原理
我们的Graph类仅仅需要6个参数,canvasId, minX, minY, maxX, maxY和 unitsPerTick。实例化完成后,该实例调用drawXAxis()方法绘制x轴,调用drawYAxis()方法绘制y轴。
Graph对象的精华是drawEquation()方法,该方法接受一个方程f(x),一个线条颜色,一个线条宽度参数。虽然该方法相对较短(大约20行代码),但它实际上很强大。其工作原理如下:
- 该方法定位画布上下文,缩放上下文以适应画布,调用scale()方法,通过给y分量乘以-1来翻转y轴。
- 画布上下文准备就绪后,使用equation()函数来确定x等于minX时的y值,即f(minX)。
- 调用moveTo()方法移动绘制光标。
- 使用一个for循环,每个迭代中,慢慢增加x值,并使用f(x)方程确定相应的y值。
- 调用lineTo()方法,从上一个点到当前点画直线。
- 继续循环,直到x等于maxX。
由于每次迭代绘制的线条都很短,肉眼无法分辨,最终产生平滑曲线的错觉感。
页面加载完成后,我们可以实例化一个Graph对象,并调用drawEquation()方法,来绘制一条绿色的正弦波,一条蓝色的抛物线方程,和一条红色的直线方程。
相关参考
- 第1章 绘制直线
- 第2章 处理文本
- 第4章 平移画布上下文
- 第4章 旋转画布上下文
- 第4章 创建镜像变换

