类神经网路 Neural_Networks - Ex 2: Restricted Boltzmann Machine features for digit classification
优质
小牛编辑
139浏览
2023-12-01
http://scikit-learn.org/stable/auto_examples/neural_networks/plot_rbm_logistic_classification.html
此范例将使用BernoulliRBM特征选取方法,提升手写数字识别的精确率,伯努利限制玻尔兹曼机器模型(`BernoulliRBM
`)将可以对数据做有效的非线性
特征提取的处理。
为了让此模型训练出来更为强健,将输入的图档,分别做上左右下,一像素的平移,用以增加更多训练资料,
训练网路的参数是使用grid search演算法,但此训练太耗费时间,因此不再这重现,。
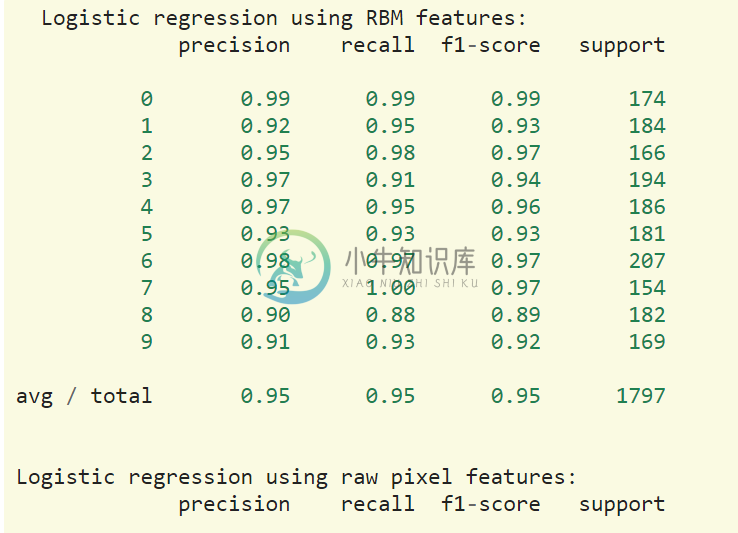
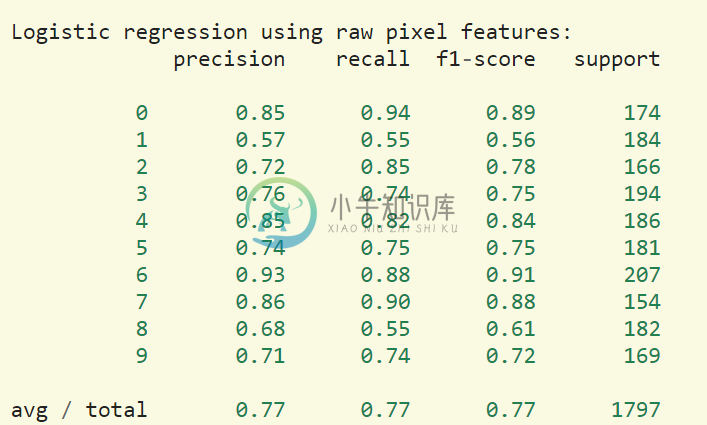
此范例结果将比较,
1.使用原本的像素值做的逻辑回归
2.使用BernoulliRBM做特征选取的逻辑回归
结果将显示:使用BernoulliRBM将可以提升分类的准确度。
(一)引入函式库与资料
from __future__ import print_functionprint(__doc__)# Authors: Yann N. Dauphin, Vlad Niculae, Gabriel Synnaeve# License: BSDimport numpy as npimport matplotlib.pyplot as pltfrom scipy.ndimage import convolvefrom sklearn import linear_model, datasets, metricsfrom sklearn.model_selection import train_test_splitfrom sklearn.neural_network import BernoulliRBMfrom sklearn.pipeline import Pipeline
(二)资料前处理、读取资料、选取模型
def nudge_dataset(X, Y):"""此副函式是用来将输入资料的数字图形,分别做上左右下一像素的平移,目的是制造更多的训练资料让模型训练出来更强健"""direction_vectors = [[[0, 1, 0],[0, 0, 0],[0, 0, 0]],[[0, 0, 0],[1, 0, 0],[0, 0, 0]],[[0, 0, 0],[0, 0, 1],[0, 0, 0]],[[0, 0, 0],[0, 0, 0],[0, 1, 0]]]shift = lambda x, w: convolve(x.reshape((8, 8)), mode='constant',weights=w).ravel()X = np.concatenate([X] +[np.apply_along_axis(shift, 1, X, vector)for vector in direction_vectors])Y = np.concatenate([Y for _ in range(5)], axis=0)return X, Y# Load Datadigits = datasets.load_digits()X = np.asarray(digits.data, 'float32')X, Y = nudge_dataset(X, digits.target)X = (X - np.min(X, 0)) / (np.max(X, 0) + 0.0001) # 将灰阶影像降尺度降到[0,1]# 将资料切割成训练集与测试集X_train, X_test, Y_train, Y_test = train_test_split(X, Y,test_size=0.2,random_state=0)# Models we will uselogistic = linear_model.LogisticRegression()rbm = BernoulliRBM(random_state=0, verbose=True)classifier = Pipeline(steps=[('rbm', rbm), ('logistic', logistic)])
(三)设定模型参数与训练模型
# 参数选择需使用cross-validation去比较# 此参数是使用GridSearchCV找出来的. Here we are not performing cross-validation to save time.#GridSratch 就是将参数设定好,跑过全部参数后去找结果最好的一组参数rbm.learning_rate = 0.06rbm.n_iter = 20#.n_components = 100 表示隐藏层单元为100,即表示萃取出100个特征,特征萃取的越多准确率会越高,但越耗时间rbm.n_components = 100logistic.C = 6000.0# Training RBM-Logistic Pipelineclassifier.fit(X_train, Y_train)# Training Logistic regressionlogistic_classifier = linear_model.LogisticRegression(C=100.0)logistic_classifier.fit(X_train, Y_train)
(四)评估模型的分辨准确率
print()print("Logistic regression using RBM features:\n%s\n" % (metrics.classification_report(Y_test,classifier.predict(X_test))))print("Logistic regression using raw pixel features:\n%s\n" % (metrics.classification_report(Y_test,logistic_classifier.predict(X_test))))


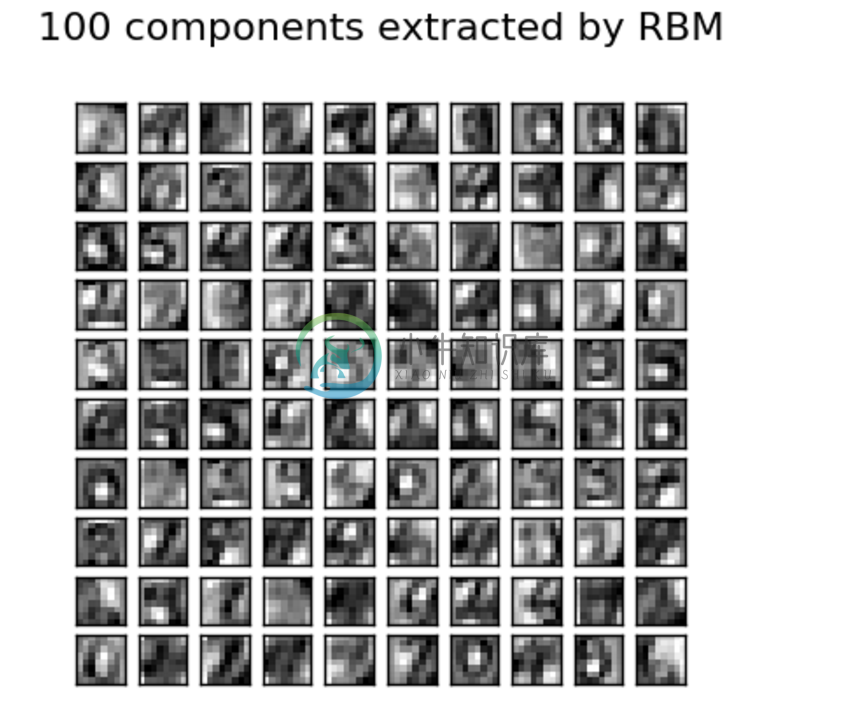
(五)画出100个RBM萃取出的特征
plt.figure(figsize=(4.2, 4))for i, comp in enumerate(rbm.components_):plt.subplot(10, 10, i + 1)plt.imshow(comp.reshape((8, 8)), cmap=plt.cm.gray_r,interpolation='nearest')plt.xticks(())plt.yticks(())plt.suptitle('100 components extracted by RBM', fontsize=16)plt.subplots_adjust(0.08, 0.02, 0.92, 0.85, 0.08, 0.23)plt.show()

(六)完整程式码
from __future__ import print_functionprint(__doc__)# Authors: Yann N. Dauphin, Vlad Niculae, Gabriel Synnaeve# License: BSDimport numpy as npimport matplotlib.pyplot as pltfrom scipy.ndimage import convolvefrom sklearn import linear_model, datasets, metricsfrom sklearn.model_selection import train_test_splitfrom sklearn.neural_network import BernoulliRBMfrom sklearn.pipeline import Pipeline################################################################################ Setting updef nudge_dataset(X, Y):"""This produces a dataset 5 times bigger than the original one,by moving the 8x8 images in X around by 1px to left, right, down, up"""direction_vectors = [[[0, 1, 0],[0, 0, 0],[0, 0, 0]],[[0, 0, 0],[1, 0, 0],[0, 0, 0]],[[0, 0, 0],[0, 0, 1],[0, 0, 0]],[[0, 0, 0],[0, 0, 0],[0, 1, 0]]]shift = lambda x, w: convolve(x.reshape((8, 8)), mode='constant',weights=w).ravel()X = np.concatenate([X] +[np.apply_along_axis(shift, 1, X, vector)for vector in direction_vectors])Y = np.concatenate([Y for _ in range(5)], axis=0)return X, Y# Load Datadigits = datasets.load_digits()X = np.asarray(digits.data, 'float32')X, Y = nudge_dataset(X, digits.target)X = (X - np.min(X, 0)) / (np.max(X, 0) + 0.0001) # 0-1 scalingX_train, X_test, Y_train, Y_test = train_test_split(X, Y,test_size=0.2,random_state=0)# Models we will uselogistic = linear_model.LogisticRegression()rbm = BernoulliRBM(random_state=0, verbose=True)classifier = Pipeline(steps=[('rbm', rbm), ('logistic', logistic)])################################################################################ Training# Hyper-parameters. These were set by cross-validation,# using a GridSearchCV. Here we are not performing cross-validation to# save time.rbm.learning_rate = 0.06rbm.n_iter = 20# More components tend to give better prediction performance, but larger# fitting timerbm.n_components = 100logistic.C = 6000.0# Training RBM-Logistic Pipelineclassifier.fit(X_train, Y_train)# Training Logistic regressionlogistic_classifier = linear_model.LogisticRegression(C=100.0)logistic_classifier.fit(X_train, Y_train)################################################################################ Evaluationprint()print("Logistic regression using RBM features:\n%s\n" % (metrics.classification_report(Y_test,classifier.predict(X_test))))print("Logistic regression using raw pixel features:\n%s\n" % (metrics.classification_report(Y_test,logistic_classifier.predict(X_test))))################################################################################ Plottingplt.figure(figsize=(4.2, 4))for i, comp in enumerate(rbm.components_):plt.subplot(10, 10, i + 1)plt.imshow(comp.reshape((8, 8)), cmap=plt.cm.gray_r,interpolation='nearest')plt.xticks(())plt.yticks(())plt.suptitle('100 components extracted by RBM', fontsize=16)plt.subplots_adjust(0.08, 0.02, 0.92, 0.85, 0.08, 0.23)plt.show()

