
Highcharts .NET
Highcharts .NET 是我们基于 .NET 平台封装的 Highcharts,可以很方便的在 .NET 开发环境中使用 Highcharts 创建交互性图表。
开发环境
Highcharts.Net 的运行需要以下两个 framework:
- ASP.NET 4.x +
- ASP.NET MVC 4 + 或 ASP.NET Web Forms 4 +
下载或安装依赖包
Highcharts .NET 相关的 DLL 文件有两种方法获取:
1、下载获得
下载地址:Highcharts_ASPNET_MVC.zip
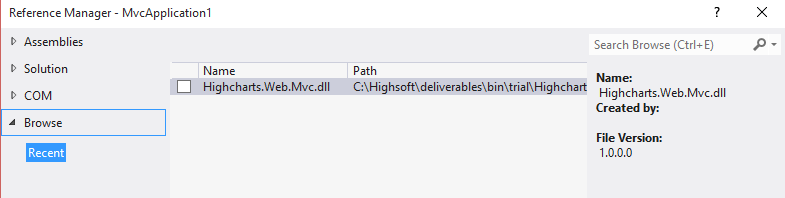
下载后解压然后在项目中通过 References 的形式添加相应的 DLL 文件,详细过程是:
创建一个新的 ASP.NET Web 应用程序项目(.NET Framework,选择 MVC 或 Web Forms 模板),然后在项目中的 “References” 菜单中右键,点击 “Add Reference…” 选项来添加依赖。

接下来进入到解压后的 Highcharts for ASP.NET MVC 所在的目录,然后将 Highcharts.Web.Mvc.dll 这个文件添加到项目中。
2、通过 NuGet 安装
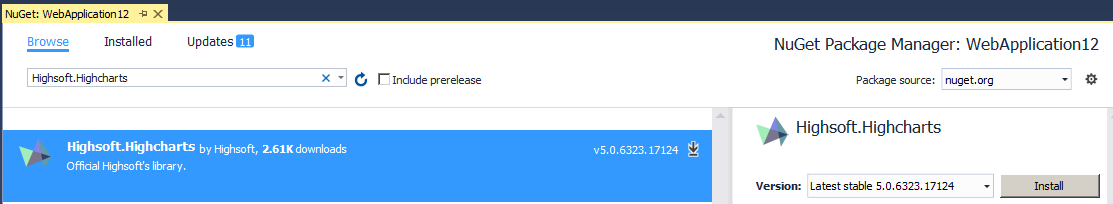
创建项目(同方法1),然后在项目的 “References” 项目右键,选择 “Manage NuGet Packages” 菜单。

通过搜索 “Highsoft.Higcharts” 或 “Highsoft.Highstock” 来获取对应的包,然后点击并安装对应的包即可。
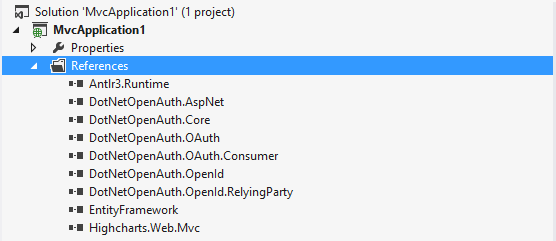
安装完毕后,Highcharts.Web.Mvc 文件就会在项目的 references 中,如下图所示
3、其他 IDE
如果你使用的 IDE 不是 Visual Studio .NET,请参考上面的方法,在 IDE 中找到 References 菜单并添加 Highcharts.Web.Mvc.dll ,或者直接将这个文件复制到项目的 /bin 目录中。
试用和正式版本
我们提供 30 天试用版本,试用版和正式版功能是完全一样的,唯一的试用版超过 30 天将不能继续使用,这时候需要授权码来继续试用,添加授权码的方式是在 Web.config 文件 appSettings 里添加key 为 Highcharts,值为授权码的配置,例如
<add key="Highcharts" value="您的授权码"/>
MVC 示例
点击下载 项目源码
1、给视图添加引用
第一步是在示例页面视图的顶部添加依赖,代码如下:
@using Highsoft.Web.Mvc.Charts
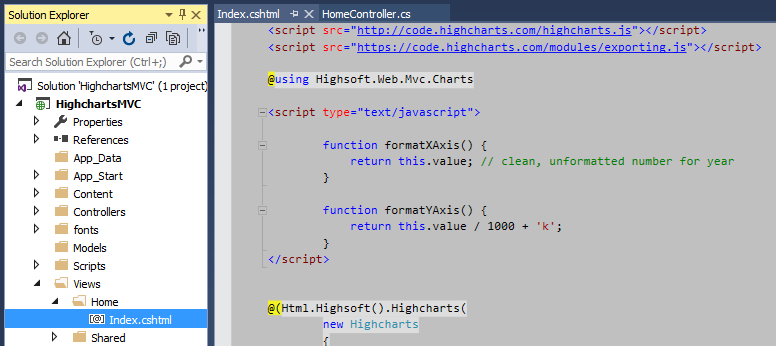
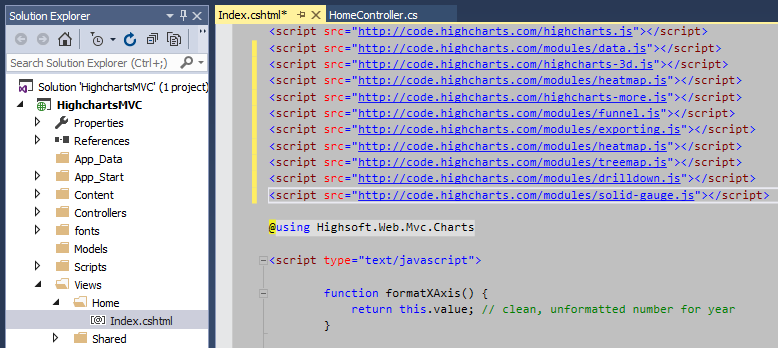
2、添加 JS 文件
通过下面的代码引入 highcharts.js
<script src="http://cdn.hcharts.cn/highcharts/highcharts.js"></script>
在 Highcharts 中某些图表需要依赖额外的文件,这些文件的引用请参考:文件下载与使用。
3、在视图中定义图表
图表定义可以在 HTML 中的任意位置,这取决于您的代码布局,下面是定义图表的示例代码:
@(Html.Highsoft().Highcharts(
    new Highcharts {
        Chart = new Chart {
            Width = 1087,
                Height = 400,
                Type = ChartType.Area
        },
        // 其他配置...,
    },
    "chart")

其中 Html.Highsoft().Highcharts 为 Highcharts 初始化方法,传递两个参数,第一个是 Highcharts 配置,第二个参数为 div 的 ID。更多关于 Highcharts 配置选项请参考 API 文档。
4、添加数据
1、定义数据列
首先需要在 Highcharts 对象下的 Series 里定义数据列配置,示例代码如下:
@(Html.Highsoft().Highcharts(
    new Highcharts
    {
        Chart = new Chart
        {
            Width = 1087,
            Height = 400,
            Type = ChartType.Area
        },
        // …
        Series = new List<Series>
        {
            new AreaSeries
            {
                Name = "USA",
                Data = @ViewData["usaData"] as List<AreaSeriesData>
            },
            new AreaSeries
            {
                Name = "USSR/Russia",
                Data = @ViewData["russiaData"] as List<AreaSeriesData>
            }
        }
    }
    , "chart")
其中数据列里的数据一般是来自于 Controller,即使用 ASP.NET MVC 的 ViewData 机制(当然也可以使用 ViewBag 或指定在视图里定义数据)。
2、定义数据
定义数据的方式有两种,一种是从 Controller 传递数据到视图(最常用),另外一种是直接在视图中定义。
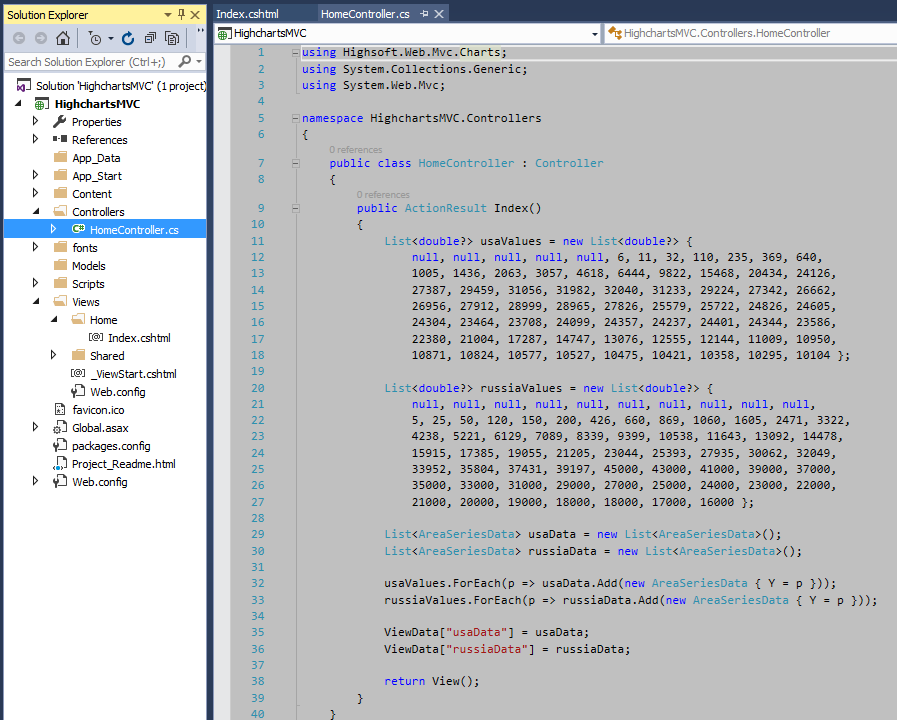
示例:在 Controller 中定义数据并返回给视图
public ActionResult AreaBasic()
{
    // 这里用静态数据,一般是做数据库查询
    List<double?> usaValues = new List<double?> {
        null, null, null, null, null, 6, 11, 32, 110, 235, 369, 640,
        1005, 1436, 2063, 3057, 4618, 6444, 9822, 15468, 20434, 24126,
        27387, 29459, 31056, 31982, 32040, 31233, 29224, 27342, 26662,
        26956, 27912, 28999, 28965, 27826, 25579, 25722, 24826, 24605,
        24304, 23464, 23708, 24099, 24357, 24237, 24401, 24344, 23586,
        22380, 21004, 17287, 14747, 13076, 12555, 12144, 11009, 10950,
        10871, 10824, 10577, 10527, 10475, 10421, 10358, 10295, 10104 };
    List<double?> russiaValues = new List<double?> {
        null, null, null, null, null, null, null, null, null, null,
        5, 25, 50, 120, 150, 200, 426, 660, 869, 1060, 1605, 2471, 3322,
        4238, 5221, 6129, 7089, 8339, 9399, 10538, 11643, 13092, 14478,
        15915, 17385, 19055, 21205, 23044, 25393, 27935, 30062, 32049,
        33952, 35804, 37431, 39197, 45000, 43000, 41000, 39000, 37000,
        35000, 33000, 31000, 29000, 27000, 25000, 24000, 23000, 22000,
        21000, 20000, 19000, 18000, 18000, 17000, 16000 };

   // 这个示例使用面积图,所以用 AreaSeriesData,其他类型的图表用对应的 SeriesData 即可
    List<AreaSeriesData> usaData = new List<AreaSeriesData>();
    List<AreaSeriesData> russiaData = new List<AreaSeriesData>();
    usaValues.ForEach(p => usaData.Add(new AreaSeriesData { Y = p }));
    russiaValues.ForEach(p => russiaData.Add(new AreaSeriesData { Y = p }));

    // 通过 ViewData 设置值,在视图中对应的用 @ViewData["usaData"] 来取值
    ViewData["usaData"] = usaData;
    ViewData["russiaData"] = russiaData;
    return View();
}
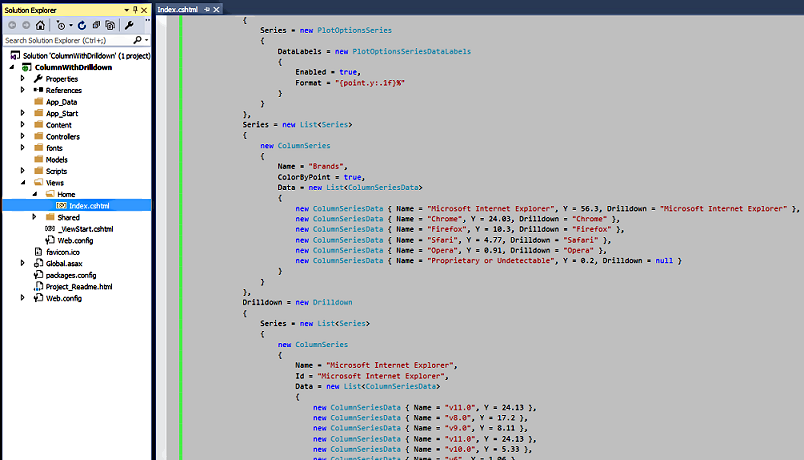
示例:直接在视图中定义数据
@(Html.Highsoft().Highcharts(
    new Highcharts
    {
        Chart = new Chart
        {
            Width = 1087,
            Height = 400,
            Type = ChartType.Column
        },
        Series = new List<Series>
        {
            new ColumnSeries
            {
                Name = "Brands",
                ColorByPoint = true,
                // 直接在视图中定义数据
                Data = new List<ColumnSeriesData>
                {
                    new ColumnSeriesData { Name = "Microsoft Internet Explorer", Y = 56.3, Drilldown = "Microsoft Internet Explorer" },
                    new ColumnSeriesData { Name = "Chrome", Y = 24.03, Drilldown = "Chrome" },
                    new ColumnSeriesData { Name = "Firefox", Y = 10.3, Drilldown = "Firefox" },
                    new ColumnSeriesData { Name = "Sfari", Y = 4.77, Drilldown = "Safari" },
                    new ColumnSeriesData { Name = "Opera", Y = 0.91, Drilldown = "Opera" },
                    new ColumnSeriesData { Name = "Proprietary or Undetectable", Y = 0.2, Drilldown = null }
                }
            }
        },
        //
     }, "chart")
Web Forms 示例
点击下载 项目源码
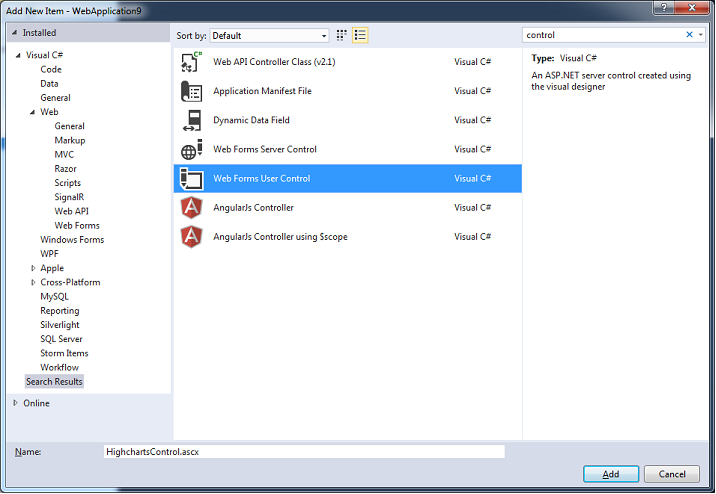
1、创建 Controller
在 Controls 目录下创建一个新的 Controller

选择 Web Forms User Control 并命名为 HighchartsControl.ascx
2、创建并渲染图表
打开 HighchartsControl.ascx.cs ,开始编写代码,步骤如下:
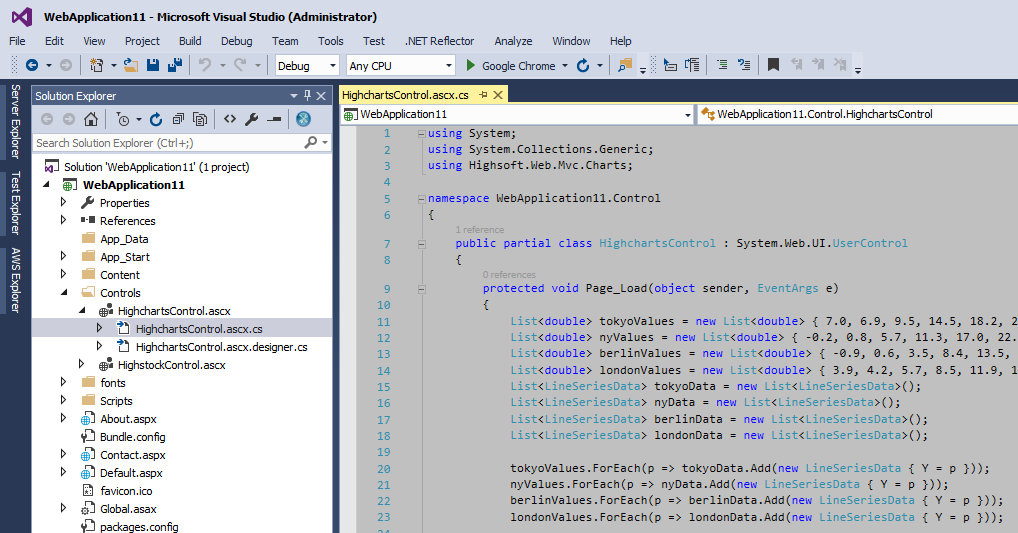
1)添加 using Highsoft.Web.Mvc.Charts;.
using Highsoft.Web.Mvc.Charts;
2)在 Page_Load 方法里创建图表对象
public partial class HighchartsControl : System.Web.UI.UserControl
{
    protected void Page_Load(object sender, EventArgs e)
    {
        //…
        Highcharts higcharts = new Highcharts
        {
            Title = new Title
            {
                Text = "Monthly Average Temperature",
                X = -20
            },
            Subtitle = new Subtitle
            {
                Text = "Source: WorldClimate.com",
                X = -20
            },
            XAxis = new List
            {
                new XAxis
                {
                    Categories = new List { "Jan", "Feb", "Mar", "Apr", "May", "Jun",
                            "Jul", "Aug", "Sep", "Oct", "Nov", "Dec" },
                }
            },
            YAxis = new List
            {
                new YAxis
                {
                    Title = new YAxisTitle
                    {
                        Text = "Temperature (°C)"
                    },
                    PlotLines = new List
                    {
                        new YAxisPlotLines
                        {
                            Value = 0,
                            Width = 1,
                            Color = "#808080"
                        }
                    }
                }
            },
            Tooltip = new Tooltip
            {
                ValueSuffix = "°C"
            },
            Legend = new Legend
            {
                Layout = LegendLayout.Vertical,
                Align = LegendAlign.Right,
                VerticalAlign = LegendVerticalAlign.Middle,
                BorderWidth = 0
            },
            Series = new List
            {
                new LineSeries
                {
                    Name = "Tokyo",
                    Data = tokyoData as List
                },
                new LineSeries
                {
                    Name = "NY",
                    Data = nyData as List
                },
                new LineSeries
                {
                    Name = "Berlin",
                    Data = berlinData as List
                },
                new LineSeries
                {
                    Name = "London",
                    Data = londonData as List
                }
            }
        };
        //…
    }
}
3)使用 HighsoftNamespace 将图表对象渲染到页面
The chart‘s HTML code needs to be received, that is why you need to add a HighsoftNamespace. To do so, scroll down to the end of the method, then add HighsoftNamespace.
HighsoftNamespace Highsoft = new HighsoftNamespace();
//string result = Highsoft.Highcharts(higcharts, "chart").ToHtmlString(); //For version 5.0.6326 or older
string result = Highsoft.GetHighcharts(higcharts, "chart").ToHtmlString(); //For version 5.0.6327 or newer
4)将结果写入到 html
Response.Write(result);
3、将 Controller 添加在网页中
打开示例中的 Default.aspx,并按照下面的步骤进行操作:
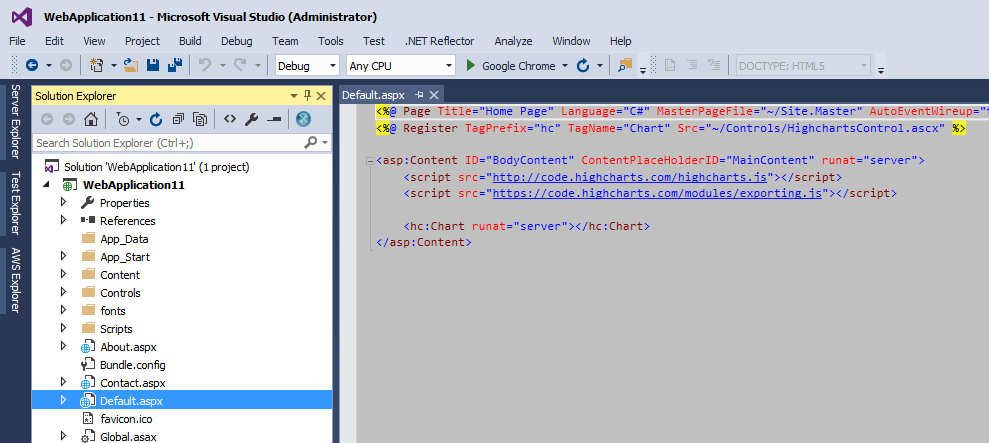
1)注册 HighchartsControl
<%@ Register TagPrefix="hc" TagName="Chart" Src="~/Controls/HighchartsControl.ascx" %>
2)引入依赖的 JavaScript 文件
<script src="http://code.highcharts.com/highcharts.js"></script>
<script src="https://code.highcharts.com/modules/exporting.js"></script>
3)使用 HighchartControl
<hc:Chart runat="server"></hc:Chart>