
Debug tensorflow
Welcome!
Contents
- Introduction: Why debugging in TensorFlow is difficult
- Basic and advanced methods for debugging TensorFlow codes
- General tips and guidelines for easy-debuggable code
- Benchmarking and profiling TensorFlow codes
A Disclaimer
- This talk is NOT about how to debug your ML/DL model (e.g. my model is not fitting well), but about how to debug your TF codes in a programming perspective
- I had to assume that the audience is somewhat familiar with basics of TensorFlow and Deep Learning; it would be very good if you have an experience to write a TensorFlow code by yourself
- Questions are highly welcomed! Please feel free to interrupt!
Debugging?
Debugging TensorFlow Application is ...
Debugging TensorFlow Application is ...
- Difficult!
Debugging TensorFlow Application is ...
Difficult!
Do you agree? Life is not that easy
Review: TensorFlow Computation Mechanics
- The core concept of TensorFlow: The Computation Graph
- See Also: TensorFlow Mechanics 101

Review: TensorFlow Computation Mechanics
(from TensorFlow docs)
TensorFlow programs are usually structured into
- a construction phase, that assembles a graph, and
- an execution phase that uses a session to execute ops in the graph.
Review: in pure numpy ...
W1, b1, W2, b2, W3, b3 = init_parameters()
def multilayer_perceptron(x, y_truth):
    # (i) feed-forward pass
    assert x.dtype == np.float32 and x.shape == [batch_size, 784] # numpy!
    fc1 = fully_connected(x, W1, b1, activation_fn='relu')    # [B, 256]
    fc2 = fully_connected(fc1, W2, b2, activation_fn='relu')  # [B, 256]
    out = fully_connected(fc2, W3, b3, activation_fn=None)    # [B, 10]
    # (ii) loss and gradient, backpropagation
    loss = softmax_cross_entropy_loss(out, y_truth)   # loss as a scalar
    param_gradients = _compute_gradient(...)  # just an artificial example :)
    return out, loss, param_gradients
def train():
    for epoch in range(10):
        epoch_loss = 0.0
        batch_steps = mnist.train.num_examples / batch_size
        for step in range(batch_steps):
            batch_x, batch_y = mnist.train.next_batch(batch_size)
            y_pred, loss, gradients = multilayer_perceptron(batch_x, batch_y)
            for v, grad_v in zip(all_params, gradients):
                v = v - learning_rate * grad_v
            epoch_loss += c / batch_steps
        print "Epoch %02d, Loss = %.6f" % (epoch, epoch_loss)
Review: with TensorFlow
def multilayer_perceptron(x):
    fc1 = layers.fully_connected(x, 256, activation_fn=tf.nn.relu)
    fc2 = layers.fully_connected(fc1, 256, activation_fn=tf.nn.relu)
    out = layers.fully_connected(fc2, 10, activation_fn=None)
    return out
x = tf.placeholder(tf.float32, [None, 784])
y = tf.placeholder(tf.float32, [None, 10])
pred = multilayer_perceptron(x)
loss = tf.reduce_mean(tf.nn.softmax_cross_entropy_with_logits(pred, y))
train_op = tf.train.AdamOptimizer(learning_rate=0.001).minimize(loss)
def train(session):
    batch_size = 200
    session.run(tf.initialize_all_variables())
    for epoch in range(10):
        epoch_loss = 0.0
        batch_steps = mnist.train.num_examples / batch_size
        for step in range(batch_steps):
            batch_x, batch_y = mnist.train.next_batch(batch_size)
            _, c = session.run([train_op, loss], {x: batch_x, y: batch_y})
            epoch_loss += c / batch_steps
        print "Epoch %02d, Loss = %.6f" % (epoch, epoch_loss)
Review: The Issues
def multilayer_perceptron(x):
    fc1 = layers.fully_connected(x, 256, activation_fn=tf.nn.relu)
    fc2 = layers.fully_connected(fc1, 256, activation_fn=tf.nn.relu)
    out = layers.fully_connected(fc2, 10, activation_fn=None)
    return out
x = tf.placeholder(tf.float32, [None, 784])
y = tf.placeholder(tf.float32, [None, 10])
pred = multilayer_perceptron(x)
- The actual computation is done inside
session.run(); what we just have done is to build a computation graph - The model building part (e.g.
multilayer_perceptron()) is called only once before training, so we can't access the intermediates simply- e.g. Inspecting activations of
fc1/fc2is not trivial!
- e.g. Inspecting activations of
_, c = session.run([train_op, loss], {x: batch_x, y: batch_y})Session.run()
The most important method in TensorFlow --- where every computation is performed!
tf.Session.run(fetches, feed_dict)runs the operations and evaluates infetches, subsituting the values (placeholders) infeed_dictfor the corresponding input values.
Why TensorFlow debugging is difficult?
- The concept of Computation Graph might be unfamiliar to us.
- The "Inversion of Control"
- The actual computation (feed-forward, training) of model runs inside
Session.run(), upon the computation graph, but not upon the Python code we wrote - What is exactly being done during an execution of session is under an abstraction barrier
- The actual computation (feed-forward, training) of model runs inside
- Therefore, we do not retrieve the intermediate values during the computation, unless we explicitly fetch them via
Session.run()
Debugging Facilities in TensorFlow
Debugging Scenarios
We may wish to ...
- inspect intra-layer activations (during training)
- e.g. See the output of conv5, fc7 in CNNs
- inspect parameter weights (during training)
- under some conditions, pause the execution (i.e. breakpoint) and evaluate some expressions for debugging
- during training, NaN occurs in loss and variables but I don't know why
Of course, in TensorFlow, we can do these very elegantly!
Debugging in TensorFlow: Overview
Basic ways:
- Explicitly fetch, and print (or do whatever you want)!
Session.run()
- Tensorboard: Histogram and Image Summary
- the
tf.Print()operation
Advanced ways:
- Interpose any python codelet in the computation graph
- A step-by-step debugger
tfdbg: The TensorFlow debugger
(1) Fetch tensors via Session.run()
TensorFlow allows us to run parts of graph in isolation, i.e. only the relevant part of graph is executed (rather than executing everything)
x = tf.placeholder(tf.float32)
y = tf.placeholder(tf.float32)
bias = tf.Variable(1.0)
y_pred = x ** 2 + bias     # x -> x^2 + bias
loss = (y - y_pred)**2     # l2 loss?
# Error: to compute loss, y is required as a dependency
print('Loss(x,y) = %.3f' % session.run(loss, {x: 3.0}))
# OK, print 1.000 = (3**2 + 1 - 9)**2
print('Loss(x,y) = %.3f' % session.run(loss, {x: 3.0, y: 9.0}))
# OK, print 10.000; for evaluating y_pred only, input to y is not required
print('pred_y(x) = %.3f' % session.run(y_pred, {x: 3.0}))
# OK, print 1.000 bias evaluates to 1.0
print('bias      = %.3f' % session.run(bias))
Tensor Fetching: Example
We need to access to the tensors as python expressions
def multilayer_perceptron(x):
    fc1 = layers.fully_connected(x, 256, activation_fn=tf.nn.relu)
    fc2 = layers.fully_connected(fc1, 256, activation_fn=tf.nn.relu)
    out = layers.fully_connected(fc2, 10, activation_fn=None)
    return out, fc1, fc2
net = {}
x = tf.placeholder(tf.float32, [None, 784])
y = tf.placeholder(tf.float32, [None, 10])
pred, net['fc1'], net['fc2'] = multilayer_perceptron(x)
to fetch and evaluate them:
_, c, fc1, fc2, out = session.run(
    [train_op, loss, net['fc1'], net['fc2'], pred],
    feed_dict={x: batch_x, y: batch_y})
# and do something ...
if step == 0: # XXX Debug
    print fc1[0].mean(), fc2[0].mean(), out[0]
(1) Fetch tensors via Session.run()
The Good:
- Simple and Easy.
- The most basic method to get debugging information.
- We can fetch any evaluation result in numpy arrays, anywhere (except inside
Session.run()or the computation graph).
(1) Fetch tensors via Session.run()
The Good:
- Simple and Easy.
- The most basic method to get debugging information.
- We can fetch any evaluation result in numpy arrays, anywhere (except inside
Session.run()or the computation graph).
The Bad:
- We need to hold the reference to the tensors to inspect, which might be burdensome if model becomes complex and big
(Or, we can simply pass the tensor name such asfc0/Relu:0) - The feed-forward needs to be done in an atomic way (i.e. a single call of
Session.run())
Tensor Fetching: The Bad (i)
We need to hold a reference to the tensors to inspect, which might be burdensome if model becomes complex and big
def alexnet(x):
    assert x.get_shape().as_list() == [224, 224, 3]
    conv1 = conv_2d(x, 96, 11, strides=4, activation='relu')
    pool1 = max_pool_2d(conv1, 3, strides=2)
    conv2 = conv_2d(pool1, 256, 5, activation='relu')
    pool2 = max_pool_2d(conv2, 3, strides=2)
    conv3 = conv_2d(pool2, 384, 3, activation='relu')
    conv4 = conv_2d(conv3, 384, 3, activation='relu')
    conv5 = conv_2d(conv4, 256, 3, activation='relu')
    pool5 = max_pool_2d(conv5, 3, strides=2)
    fc6 = fully_connected(pool5, 4096, activation='relu')
    fc7 = fully_connected(fc6, 4096, activation='relu')
    output = fully_connected(fc7, 1000, activation='softmax')
    return conv1, pool1, conv2, pool2, conv3, conv4, conv5, pool5, fc6, fc7
conv1, conv2, conv3, conv4, conv5, fc6, fc7, output = alexnet(images)  # ?!
_, loss_, conv1_, conv2_, conv3_, conv4_, conv5_, fc6_, fc7_ = session.run(
        [train_op, loss, conv1, conv2, conv3, conv4, conv5, fc6, fc7],
        feed_dict = {...})
Tensor Fetching: The Bad (i)
Suggestion: Using a dict or class instance (e.g. self.conv5) is a very good idea
def alexnet(x, net={}):
    assert x.get_shape().as_list() == [224, 224, 3]
    net['conv1'] = conv_2d(x, 96, 11, strides=4, activation='relu')
    net['pool1'] = max_pool_2d(net['conv1'], 3, strides=2)
    net['conv2'] = conv_2d(net['pool1'], 256, 5, activation='relu')
    net['pool2'] = max_pool_2d(net['conv2'], 3, strides=2)
    net['conv3'] = conv_2d(net['pool2'], 384, 3, activation='relu')
    net['conv4'] = conv_2d(net['conv3'], 384, 3, activation='relu')
    net['conv5'] = conv_2d(net['conv4'], 256, 3, activation='relu')
    net['pool5'] = max_pool_2d(net['conv5'], 3, strides=2)
    net['fc6'] = fully_connected(net['pool5'], 4096, activation='relu')
    net['fc7'] = fully_connected(net['fc6'], 4096, activation='relu')
    net['output'] = fully_connected(net['fc7'], 1000, activation='softmax')
    return net['output']
net = {}
output = alexnet(images, net)
# access intermediate layers like net['conv5'], net['fc7'], etc.
Tensor Fetching: The Bad (i)
Suggestion: Using a dict or class instance (e.g. self.conv5) is a very good idea
class AlexNetModel():
    # ...
    def build_model(self, x):
        assert x.get_shape().as_list() == [224, 224, 3]
        self.conv1 = conv_2d(x, 96, 11, strides=4, activation='relu')
        self.pool1 = max_pool_2d(self.conv1, 3, strides=2)
        self.conv2 = conv_2d(self.pool1, 256, 5, activation='relu')
        self.pool2 = max_pool_2d(self.conv2, 3, strides=2)
        self.conv3 = conv_2d(self.pool2, 384, 3, activation='relu')
        self.conv4 = conv_2d(self.conv3, 384, 3, activation='relu')
        self.conv5 = conv_2d(self.conv4, 256, 3, activation='relu')
        self.pool5 = max_pool_2d(self.conv5, 3, strides=2)
        self.fc6 = fully_connected(self.pool5, 4096, activation='relu')
        self.fc7 = fully_connected(self.fc6, 4096, activation='relu')
        self.output = fully_connected(self.fc7, 1000, activation='softmax')
        return self.output
model = AlexNetModel()
output = model.build_model(images)
# access intermediate layers like self.conv5, self.fc7, etc.
Tensor Fetching: The Bad (ii)
The feed-forward (sometimes) needs to be done in an atomic way (i.e. a single call of Session.run())
# a single step of training ...
[loss_value, _] = session.run([loss_op, train_op],
                           feed_dict={images: batch_image})
# After this, the model parameter has been changed due to `train_op`
#
if np.isnan(loss_value):
    # DEBUG : can we see the intermediate values for the current input?
    [fc7, prob] = session.run([net['fc7'], net['prob']],
                              feed_dict={images: batch_image})
In other words, if any input is fed via feed_dict, we may have to fetch the non-debugging-related tensors and the debugging-related tensors at the same time.
Tensor Fetching: The Bad (ii)
In fact, we can just perform an additional session.run() for debugging purposes, if it does not involve any side effect
# for debugging only, get the intermediate layer outputs.
[fc7, prob] = session.run([net['fc7'], net['prob']],
                           feed_dict={images: batch_image})
#
# Yet another feed-forward: 'fc7' are computed once more ...
[loss_value, _] = session.run([loss_op, train_op],
                           feed_dict={images: batch_image})
A workaround: Use session.partial_run() (undocumented, and still experimental)
h = sess.partial_run_setup([net['fc7'], loss_op, train_op], [images])
[loss_value, _] = sess.partial_run(h, [loss_op, train_op],
                                   feed_dict={images: batch_image})
fc7 = sess.partial_run(h, net['fc7'])
(2) Tensorboard
- An off-the-shelf monitoring and debugging tool!
Check out a must-read tutorial from TensorFlow documentation
You will need to learn
- how to use and collect scalar/histogram/image summary
- how to use
tf.summary.FileWriter(previously it wasSummaryWriter)
Tensorboard: A Quick Tutorial
def multilayer_perceptron(x):
    # inside this, variables 'fc1/weights' and 'fc1/bias' are defined
    fc1 = layers.fully_connected(x, 256, activation_fn=tf.nn.relu,
                                 scope='fc1')
    tf.summary.histogram('fc1', fc1)
    tf.summary.histogram('fc1/sparsity', tf.nn.zero_fraction(fc1))
    fc2 = layers.fully_connected(fc1, 256, activation_fn=tf.nn.relu,
                                 scope='fc2')
    tf.summary.histogram('fc2', fc2)
    tf.summary.histogram('fc2/sparsity', tf.nn.zero_fraction(fc2))
    out = layers.fully_connected(fc2, 10, scope='out')
    return out
# ... (omitted) ...
loss = tf.reduce_mean(tf.nn.softmax_cross_entropy_with_logits(
                      logits=pred, labels=y))
tf.scalar_summary('loss', loss)
# histogram summary for all trainable variables (slow?)
for v in tf.trainable_variables():
     tf.summary.histogram(v.name, v)
global_step = tf.Variable(0, dtype=tf.int32, trainable=False)
train_op = tf.train.AdamOptimizer(learning_rate=0.001)\
                   .minimize(loss, global_step=global_step)
def train(session):
    batch_size = 200
    session.run(tf.global_variables_initializer())
    merged_summary_op = tf.summary.merge_all()
    summary_writer = tf.summary.FileWriter(FLAGS.train_dir, session.graph)
    # ... (omitted) ...
        for step in range(batch_steps):
            batch_x, batch_y = mnist.train.next_batch(batch_size)
            _, c, summary = session.run(
                [train_op, loss, merged_summary_op],
                feed_dict={x: batch_x, y: batch_y})
            summary_writer.add_summary(summary,
                                       global_step.eval(session=session))
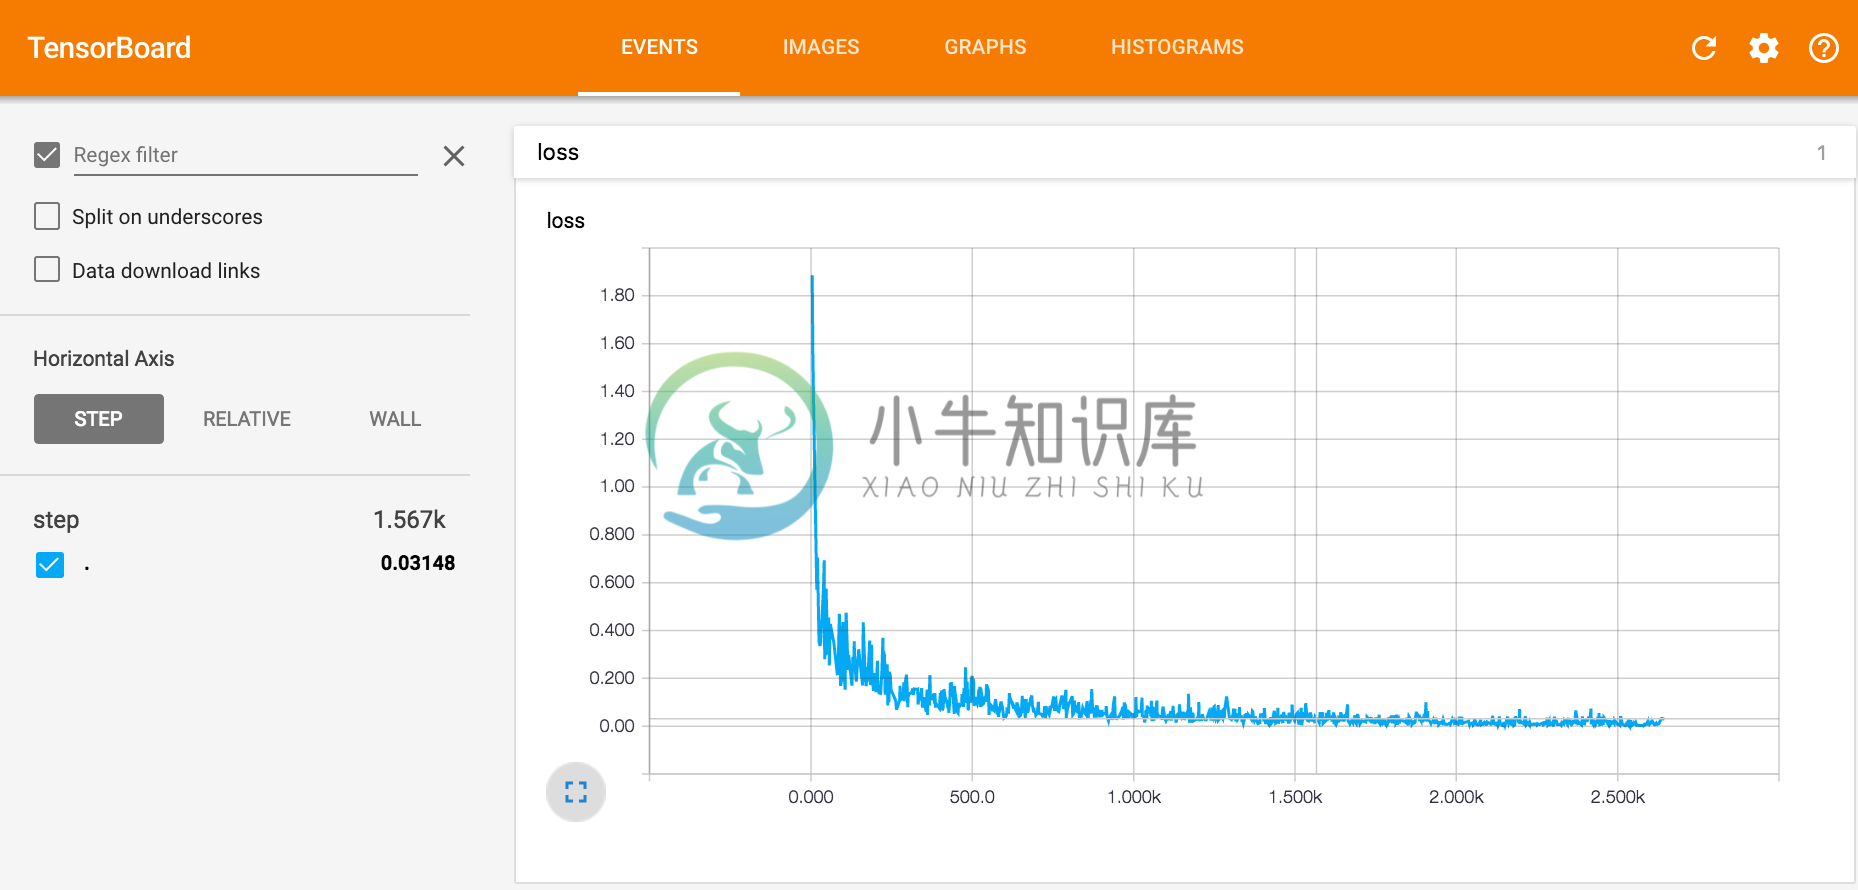
Tensorboard: A Quick Tutorial (Demo)
Scalar Summary
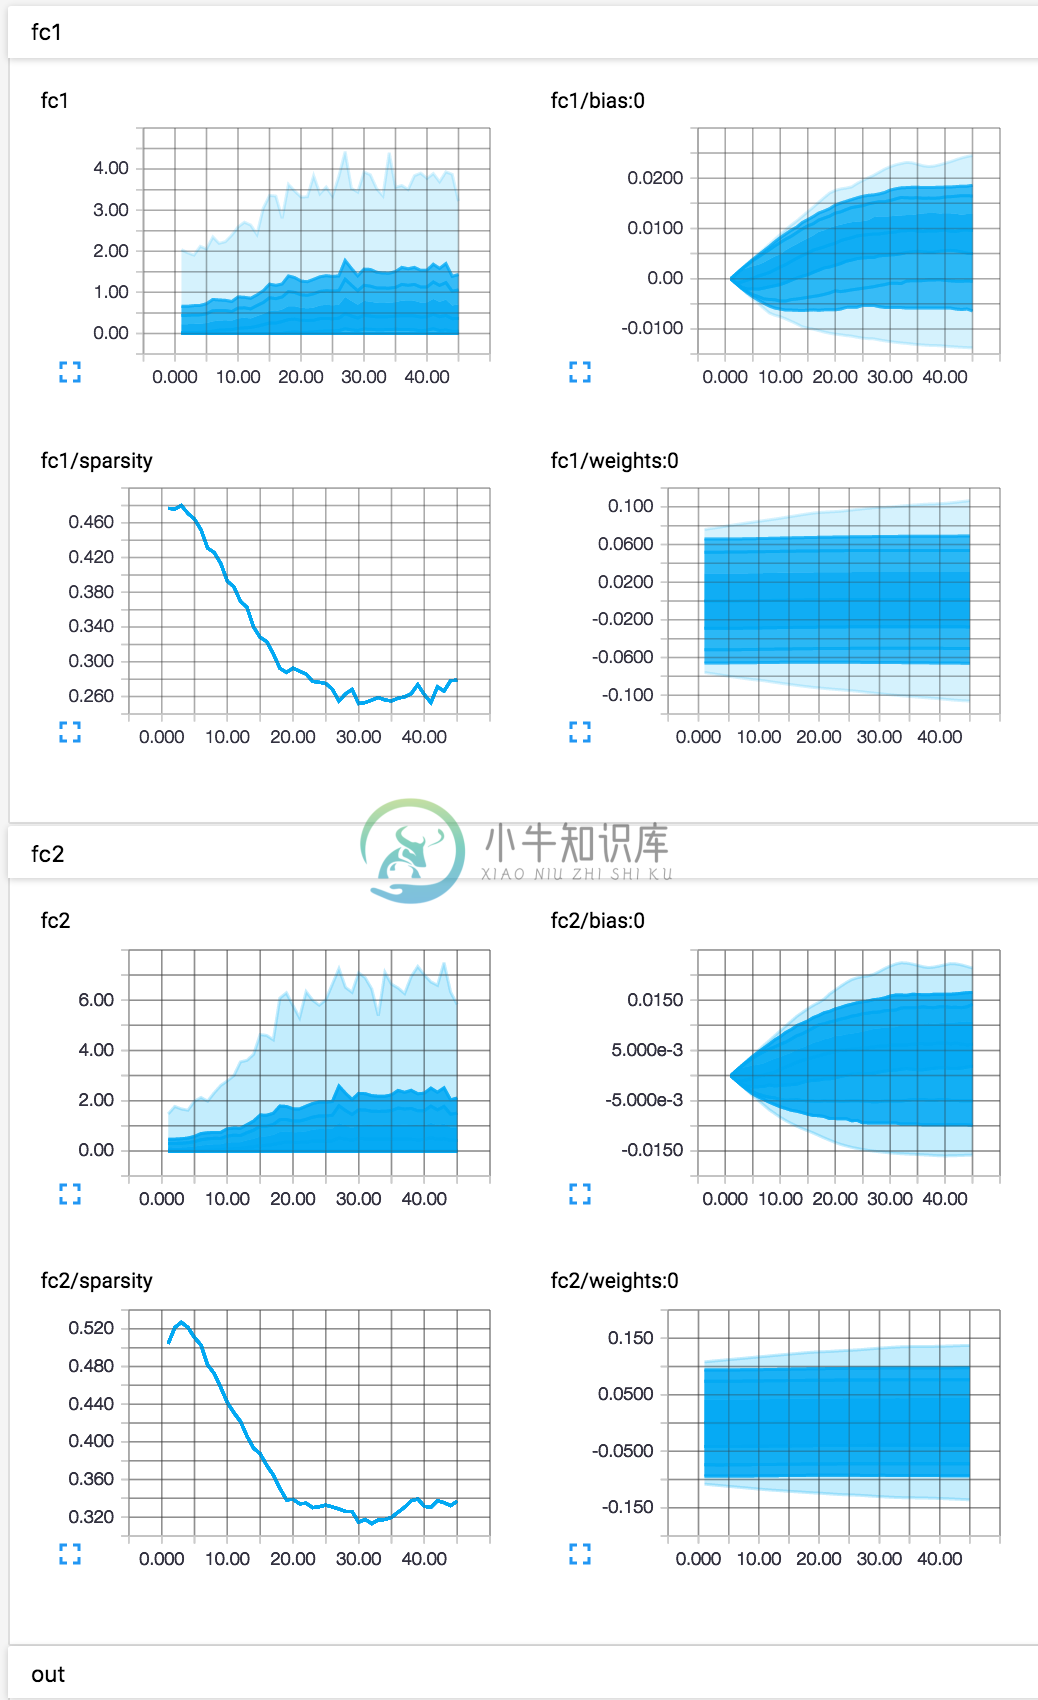
Tensorboard: A Quick Tutorial (Demo)
Histogram Summary (activations and variables)

Tensorboard and Summary: Noteworthies
Fetching histogram summary is extremely slow!
- GPU utilization can become very low (if the serialized values are huge)
- In non-debugging mode, disable it completely; or fetch summaries only periodically, e.g.
eval_tensors = [self.loss, self.train_op]
if step % 200 == 0:
    eval_tensors += [self.merged_summary_op]
eval_ret = session.run(eval_tensors, feed_dict)
eval_ret = dict(zip(eval_tensors, eval_ret))  # as a dict
current_loss = eval_ret[self.loss]
if self.merged_summary_op in eval_tensors:
    self.summary_writer.add_summary(
eval_ret[self.merged_summary_op], current_step)- I recommend to take simple and essential scalar summaries only (e.g. train/validation loss, overall accuracy, etc.), and to include debugging stuffs only on demand
Tensorboard and Summary: Noteworthies
Some other recommendations:
- Use proper names (prefixed or scoped) for tensors and variables (specifying
name=...to tensor/variable declaration) - Include both of train loss and validation loss, plus train/validation accuracy (if possible) over step
(3) tf.Print()
During run-time evaluation, we can print the value of a tensor without explicitly fetching and returning it to the code (i.e. via session.run())
tf.Print(input, data, message=None,
         first_n=None, summarize=None, name=None)
It creates an identity op with the side effect of printing data, when this op is evaluated.
(3) tf.Print(): Examples
def multilayer_perceptron(x):
    fc1 = layers.fully_connected(x, 256, activation_fn=tf.nn.relu)
    fc2 = layers.fully_connected(fc1, 256, activation_fn=tf.nn.relu)
    out = layers.fully_connected(fc2, 10, activation_fn=None)
    out = tf.Print(out, [tf.argmax(out, 1)],
                   'argmax(out) = ', summarize=20, first_n=7)
    return out
For the first seven times (i.e. 7 feed-forwards or SGD steps), it will print the predicted labels for the 20 out of batch_size examples
I tensorflow/core/kernels/logging_ops.cc:79] argmax(out) = [6 6 6 4 4 6 4 4 6 6 4 0 6 4 6 4 4 6 0 4...]
I tensorflow/core/kernels/logging_ops.cc:79] argmax(out) = [6 6 0 0 3 6 4 3 6 6 3 4 4 4 4 4 3 4 6 7...]
I tensorflow/core/kernels/logging_ops.cc:79] argmax(out) = [3 4 0 6 6 6 0 7 3 0 6 7 3 6 0 3 4 3 3 6...]
I tensorflow/core/kernels/logging_ops.cc:79] argmax(out) = [6 1 0 0 0 3 3 7 0 8 1 2 0 9 9 0 3 4 6 6...]
I tensorflow/core/kernels/logging_ops.cc:79] argmax(out) = [6 0 0 9 0 4 9 9 0 8 2 7 3 9 1 8 3 9 7 8...]
I tensorflow/core/kernels/logging_ops.cc:79] argmax(out) = [6 0 1 1 9 0 8 3 0 9 9 0 2 6 7 7 3 3 3 9...]
I tensorflow/core/kernels/logging_ops.cc:79] argmax(out) = [3 6 9 8 3 9 1 0 1 1 9 3 2 3 9 9 3 0 6 6...]
[2016-06-03 00:11:08.661563] Epoch 00, Loss = 0.332199
(3) tf.Print(): Some drawbacks ...
Cons:
- It is hard to take a full control of print formats (e.g. how do we print a 2D tensor in a matrix format?)
- Usually, we may want to print debugging values conditionally
(i.e. print them only if some condition is met) or periodically
(i.e. print just only once per epoch)tf.Print()has limitations to achieve this- TensorFlow has control flow operations; an overkill?
(3) tf.Assert()
- Asserts that the given condition is true, when evaluated (during the computation)
- If condition evaluates to
False, print the list of tensors indata, and an error is thrown.summarizedetermines how many entries of the tensors to print. tf.Assert(condition, data, summarize=None, name=None)
tf.Assert: Examples
def multilayer_perceptron(x):
    fc1 = layers.fully_connected(x, 256, activation_fn=tf.nn.relu, scope='fc1')
    fc2 = layers.fully_connected(fc1, 256, activation_fn=tf.nn.relu, scope='fc2')
    out = layers.fully_connected(fc2, 10, activation_fn=None, scope='out')
    # let's ensure that all the outputs in `out` are positive
    tf.Assert(tf.reduce_all(out > 0), [out], name='assert_out_positive')
    return out
The assertion will not work!
tf.Assert is also an op, so it should be executed as well
We need to ensure that assert_op is being executed when evaluating out:
def multilayer_perceptron(x):
    fc1 = layers.fully_connected(x, 256, activation_fn=tf.nn.relu, scope='fc1')
    fc2 = layers.fully_connected(fc1, 256, activation_fn=tf.nn.relu, scope='fc2')
    out = layers.fully_connected(fc2, 10, activation_fn=None, scope='out')
    # let's ensure that all the outputs in `out` are positive
    assert_op = tf.Assert(tf.reduce_all(out > 0), [out], name='assert_out_positive')
    with tf.control_dependencies([assert_op]):
        out = tf.identity(out, name='out')
    return out
... somewhat ugly? ... or
# ... same as above ...
out = tf.with_dependencies([assert_op], out)
return out
Another good way: store all the created assertion operations into a collection, (merge them into a single op), and explicitly evaluate them using Session.run()
def multilayer_perceptron(x):
    fc1 = layers.fully_connected(x, 256, activation_fn=tf.nn.relu, scope='fc1')
    fc2 = layers.fully_connected(fc1, 256, activation_fn=tf.nn.relu, scope='fc2')
    out = layers.fully_connected(fc2, 10, activation_fn=None, scope='out')
    tf.add_to_collection('Asserts',
         tf.Assert(tf.reduce_all(out > 0), [out], name='assert_out_gt_0')
    )
    return out
# merge all assertion ops from the collection
assert_op = tf.group(*tf.get_collection('Asserts'))
... = session.run([train_op, assert_op], feed_dict={...})Some built-in useful Assert ops
See Asserts and boolean checks in the docs!
tf.assert_negative(x, data=None, summarize=None, name=None)
tf.assert_positive(x, data=None, summarize=None, name=None)
tf.assert_proper_iterable(values)
tf.assert_non_negative(x, data=None, summarize=None, name=None)
tf.assert_non_positive(x, data=None, summarize=None, name=None)
tf.assert_equal(x, y, data=None, summarize=None, name=None)
tf.assert_integer(x, data=None, summarize=None, name=None)
tf.assert_less(x, y, data=None, summarize=None, name=None)
tf.assert_less_equal(x, y, data=None, summarize=None, name=None)
tf.assert_rank(x, rank, data=None, summarize=None, name=None)
tf.assert_rank_at_least(x, rank, data=None, summarize=None, name=None)
tf.assert_type(tensor, tf_type)
tf.is_non_decreasing(x, name=None)
tf.is_numeric_tensor(tensor)
tf.is_strictly_increasing(x, name=None)
If we need runtime assertions during computation, they are useful.
(4) Step-by-step Debugger
Python already has a powerful debugging utilities:
which are all interactive debuggers (like gdb for C/C++)
- set breakpoint
- pause, continue
- inspect stack-trace upon exception
- watch variables and evaluate expressions interactively
Debugger: Usage
Insert set_trace() for a breakpoint
def multilayer_perceptron(x):
    fc1 = layers.fully_connected(x, 256, activation_fn=tf.nn.relu, scope='fc1')
    fc2 = layers.fully_connected(fc1, 256, activation_fn=tf.nn.relu, scope='fc2')
    out = layers.fully_connected(fc2, 10, activation_fn=None, scope='out')
    import ipdb; ipdb.set_trace()  # XXX BREAKPOINT
    return out
(yeah, it is a breakpoint on model building)
Debugger: Usage
Debug breakpoints can be conditional:
for i in range(batch_steps):
    batch_x, batch_y = mnist.train.next_batch(batch_size)
    if (np.argmax(batch_y, axis=1)[:7] == [4, 9, 6, 2, 9, 6, 5]).all():
        import pudb; pudb.set_trace()  # XXX BREAKPOINT
    _, c = session.run([train_op, loss],
                        feed_dict={x: batch_x, y: batch_y})
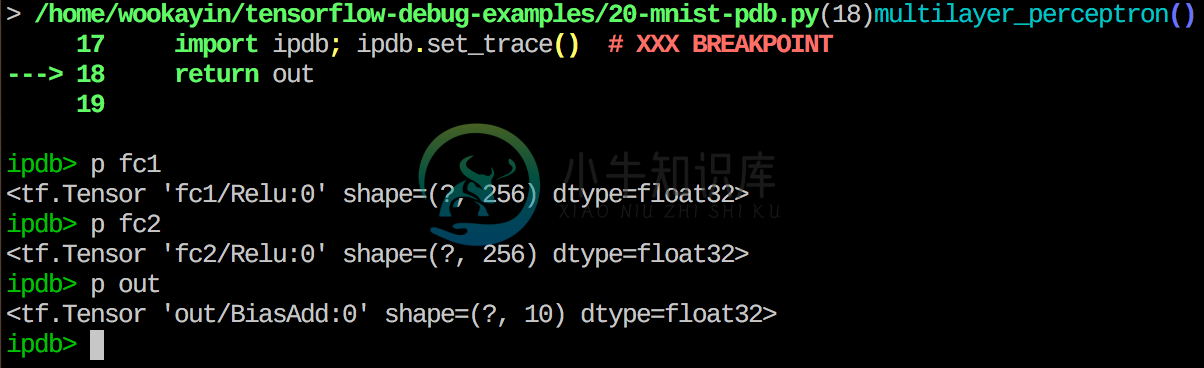
Live Demo and Case Example!! (20-mnist-pdb.py)
- Let's break on training loop if some condition is met
- Get the
fc2tensor, and fetch its evaluation result (givenx)Session.run()can be invoked and executed anywhere, even in the debugger
- Wow.... gonna love it..
Hint: Some Useful TensorFlow APIs
To get any operations or tensors that might not be stored explicitly:
tf.get_default_graph(): Get the current (default) graphG.get_operations(): List all the TF ops in the graphG.get_operation_by_name(name): Retrieve a specific TF op
(Q. How to convert an operation to a tensor?)G.get_tensor_by_name(name): Retrieve a specific tensortf.get_collection(tf.GraphKeys.~~): Get the collection of some tensors
To get variables:
tf.get_variable_scope(): Get the current variable scopetf.get_variable(): Get a variable (see Sharing Variables)tf.trainable_variables(): List all the (trainable) variables[v for v in tf.all_variables() if v.name == 'fc2/weights:0'][0]
IPython.embed()
ipdb/pudb:
import pudb; pudb.set_trace()
- They are debuggers; we can set breakpoint, see stacktraces, watch expressions, ... (much more general)
embed:
from IPython import embed; embed()
- Open an ipython shell on the current context; mostly used for watching expressions only
(5) Debugging 'inside' the computation graph
Our debugging tools so far can be used for debugging outside Session.run().
Question: How can we run a 'custom' operation? (e.g. custom layer)
(5) Debugging 'inside' the computation graph
Our debugging tools so far can be used for debugging outside Session.run().
Question: How can we run a 'custom' operation? (e.g. custom layer)
TensorFlow allows us to write a custom operation in C++ !
The 'custom' operation can be designed for logging or debugging purposes (like PrintOp)
- ... but very burdensome (need to compile, define op interface, and use it ...)
(5) Interpose any python code in the computation graph
We can also embed and interpose a python function in the graph: tf.py_func() comes to the rescue!
tf.py_func(func, inp, Tout, stateful=True, name=None)
- Wraps a python function and uses it as a tensorflow op.
- Given a python function
func, which takes numpy arrays as its inputs and returns numpy arrays as its outputs, the function is wrapped as an operation.
def my_func(x):
    # x will be a numpy array with the contents of the placeholder below
    return np.sinh(x)
inp = tf.placeholder(tf.float32, [...])
y = py_func(my_func, [inp], [tf.float32])
In other words, we are now able to use the following (hacky) tricks by intercepting the computation being executed on the graph:
- Print any intermediate values (e.g. layer activations) in a custom form without fetching them
- Use python debugger (e.g. trace and breakpoint)
- Draw a graph or plot using
matplotlib, or save images into file
Warning: Some limitations may exist, e.g. thread-safety issue, not allowed to manipulate the state of session, etc..
Case Example (i): Print
An ugly example ...
def multilayer_perceptron(x):
    fc1 = layers.fully_connected(x, 256, activation_fn=tf.nn.relu, scope='fc1')
    fc2 = layers.fully_connected(fc1, 256, activation_fn=tf.nn.relu, scope='fc2')
    out = layers.fully_connected(fc2, 10, activation_fn=None, scope='out')
    def _debug_print_func(fc1_val, fc2_val):
        print 'FC1 : {}, FC2 : {}'.format(fc1_val.shape, fc2_val.shape)
        print 'min, max of FC2 = {}, {}'.format(fc2_val.min(), fc2_val.max())
        return False
    debug_print_op = tf.py_func(_debug_print_func, [fc1, fc2], [tf.bool])
    with tf.control_dependencies(debug_print_op):
        out = tf.identity(out, name='out')
    return out
Case Example (ii): Breakpoints!
An ugly example to attach breakpoints ...
def multilayer_perceptron(x):
    fc1 = layers.fully_connected(x, 256, activation_fn=tf.nn.relu, scope='fc1')
    fc2 = layers.fully_connected(fc1, 256, activation_fn=tf.nn.relu, scope='fc2')
    out = layers.fully_connected(fc2, 10, activation_fn=None, scope='out')
    def _debug_func(x_val, fc1_val, fc2_val, out_val):
        if (out_val == 0.0).any():
            import ipdb; ipdb.set_trace()  # XXX BREAKPOINT
        from IPython import embed; embed()  # XXX DEBUG
        return False
    debug_op = tf.py_func(_debug_func, [x, fc1, fc2, out], [tf.bool])
    with tf.control_dependencies(debug_op):
        out = tf.identity(out, name='out')
    return out
Another one: The tdb library
A third-party TensorFlow debugging tool: https://github.com/ericjang/tdb
(not actively maintained and looks clunky, but still good for prototyping)
(6) tfdbg: The official TensorFlow debugger
Recent versions of TensorFlow has the official debugger (tfdbg). Still experimental, but works quite well!
Check out the HOW-TOs and Examples on tfdbg!!!
import tensorflow.python.debug as tf_debug
sess = tf.Session()
# create a debug wrapper session
sess = tf_debug.LocalCLIDebugWrapperSession(sess)
# Add a tensor filter (similar to breakpoint)
sess.add_tensor_filter("has_inf_or_nan", tf_debug.has_inf_or_nan)
# Each session.run() will be intercepted by the debugger,
# and we can inspect the value of tensors via the debugger interface
sess.run(loss, feed_dict = {x : ...})
(6) tfdbg: The TensorFlow debugger
(6) tfdbg: The TensorFlow debugger
tfdbg: Features and Quick References
Conceptually, a wrapper session is employed (currently, CLI debugger session); it can intercept a single run of session.run()
run/r: Execute the run() call with debug tensor-watchingrun -n/r -n: Execute the run() call without debug tensor-watchingrun -f <filter_name>: Keep executing run() calls until a dumped tensor passes a registered filter (conditional breakpoint)- e.g.
has_inf_or_nan
- e.g.
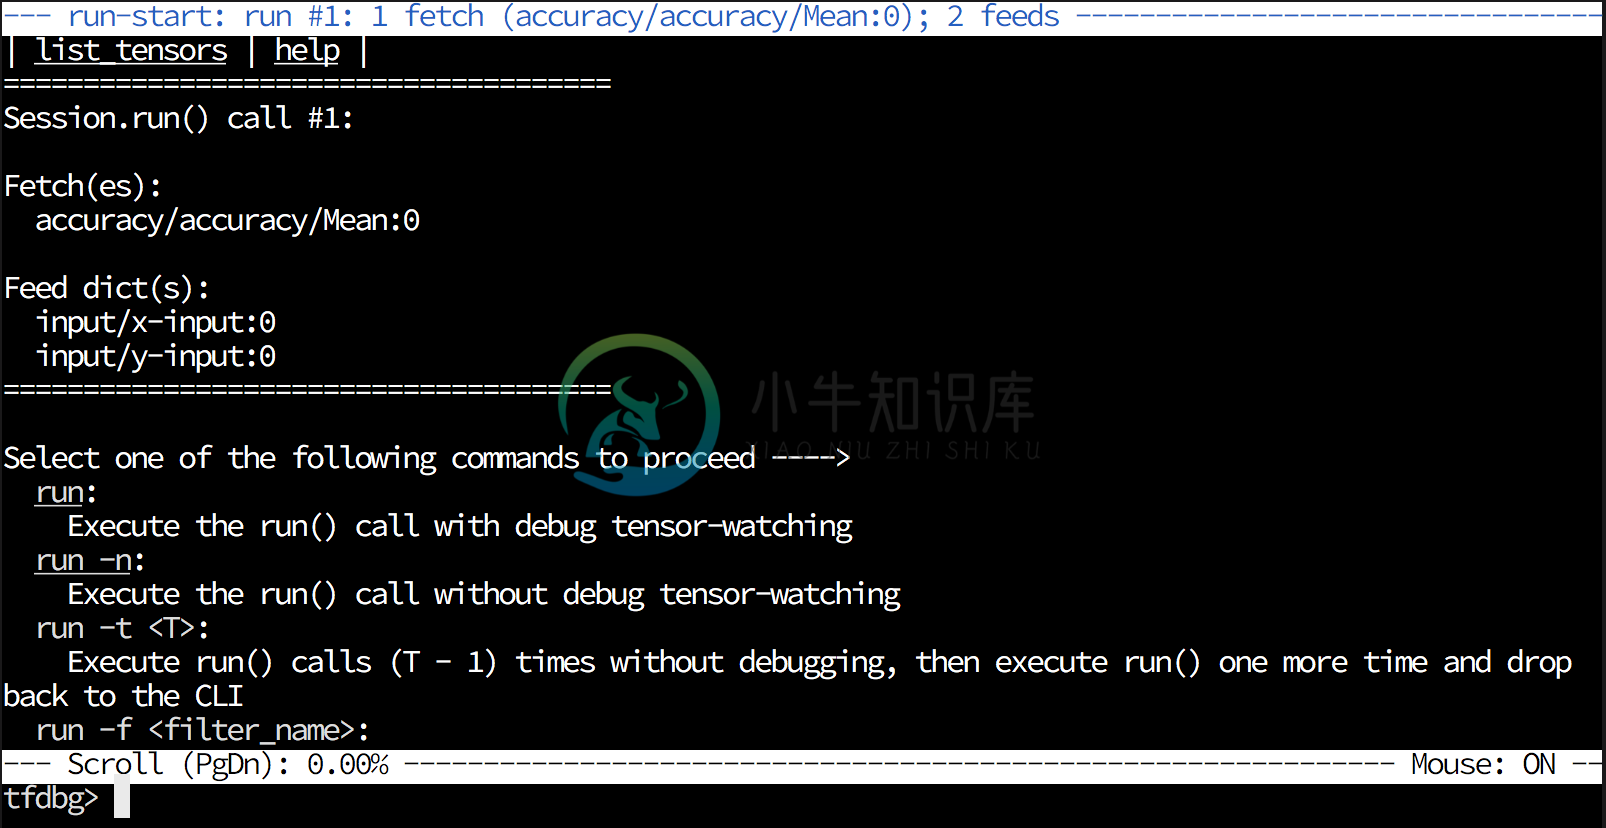
tfdbg: Tensor Filters
Registering tensor filters:
sess = tf_debug.LocalCLIDebugWrapperSession(sess)
sess.add_tensor_filter("has_inf_or_nan", tf_debug.has_inf_or_nan)
Tensor filters are just python functions (datum, tensor) -> bool:
def has_inf_or_nan(datum, tensor):
  _ = datum  # Datum metadata is unused in this predicate.
  if tensor is None:
    # Uninitialized tensor doesn't have bad numerical values.
    return False
  elif (np.issubdtype(tensor.dtype, np.float) or
        np.issubdtype(tensor.dtype, np.complex) or
        np.issubdtype(tensor.dtype, np.integer)):
    return np.any(np.isnan(tensor)) or np.any(np.isinf(tensor))
  else:
    return False
Running tensor filters are, therefore, quite slow.
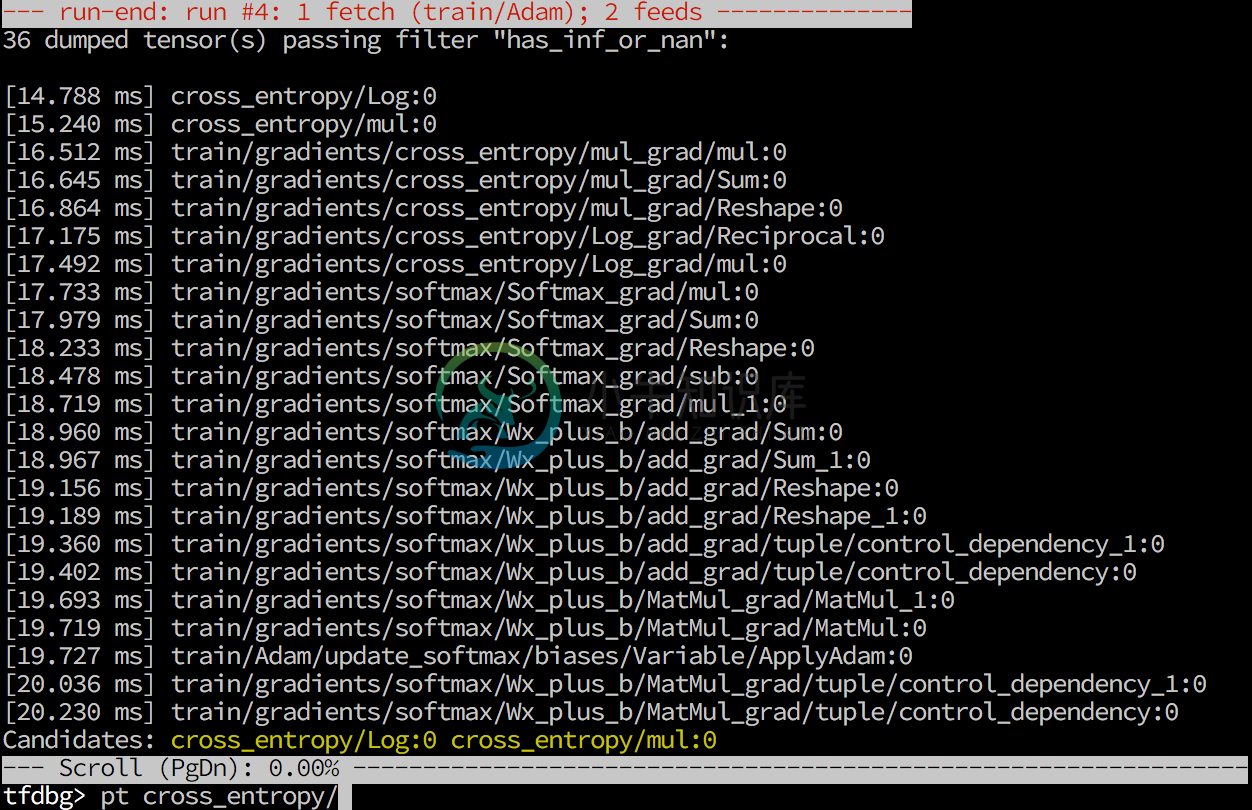
tfdbg: Tensor Fetching
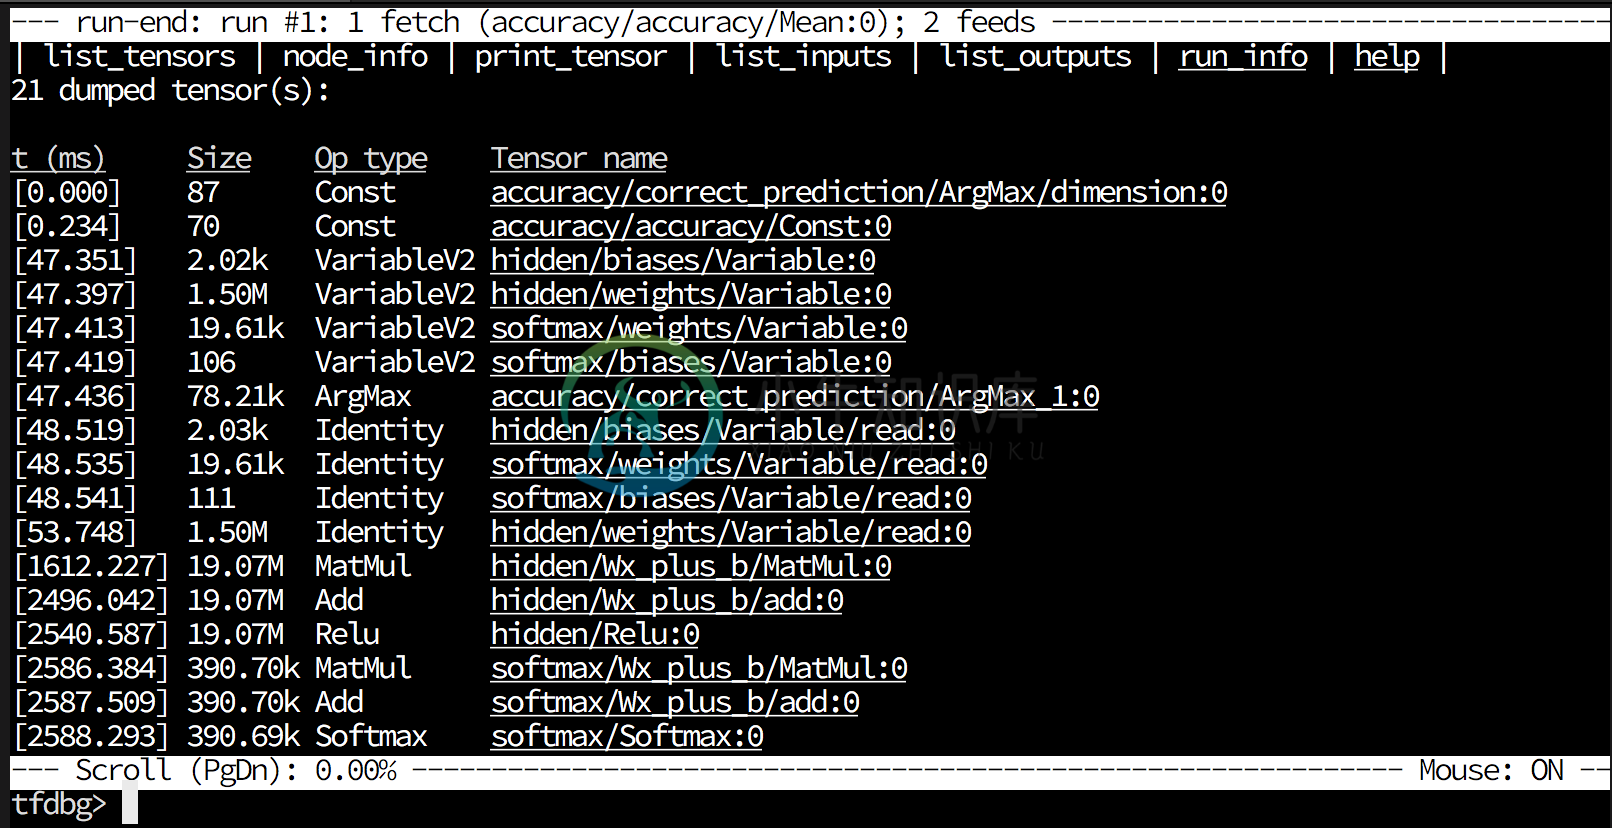
In a tensor dump mode (the run-end UI), the debugger shows the list of tensors dumped in the session.run() call:
tfdbg: Tensor Fetching
Commands:
list_tensors(lt) : Show the list of dumped tensor(s).print_tensor(pt) : Print the value of a dumped tensor.node_info(ni) : Show information about a nodeni -t: Shows the traceback of tensor creation
list_inputs(li) : Show inputs to a nodelist_outputs(lo) : Show outputs to a noderun_info(ri) : Show the information of current run
(e.g. what to fetch, what feed_dict is)invoke_stepper(s) : Invoke the stepper!run(r) : Move to the next run
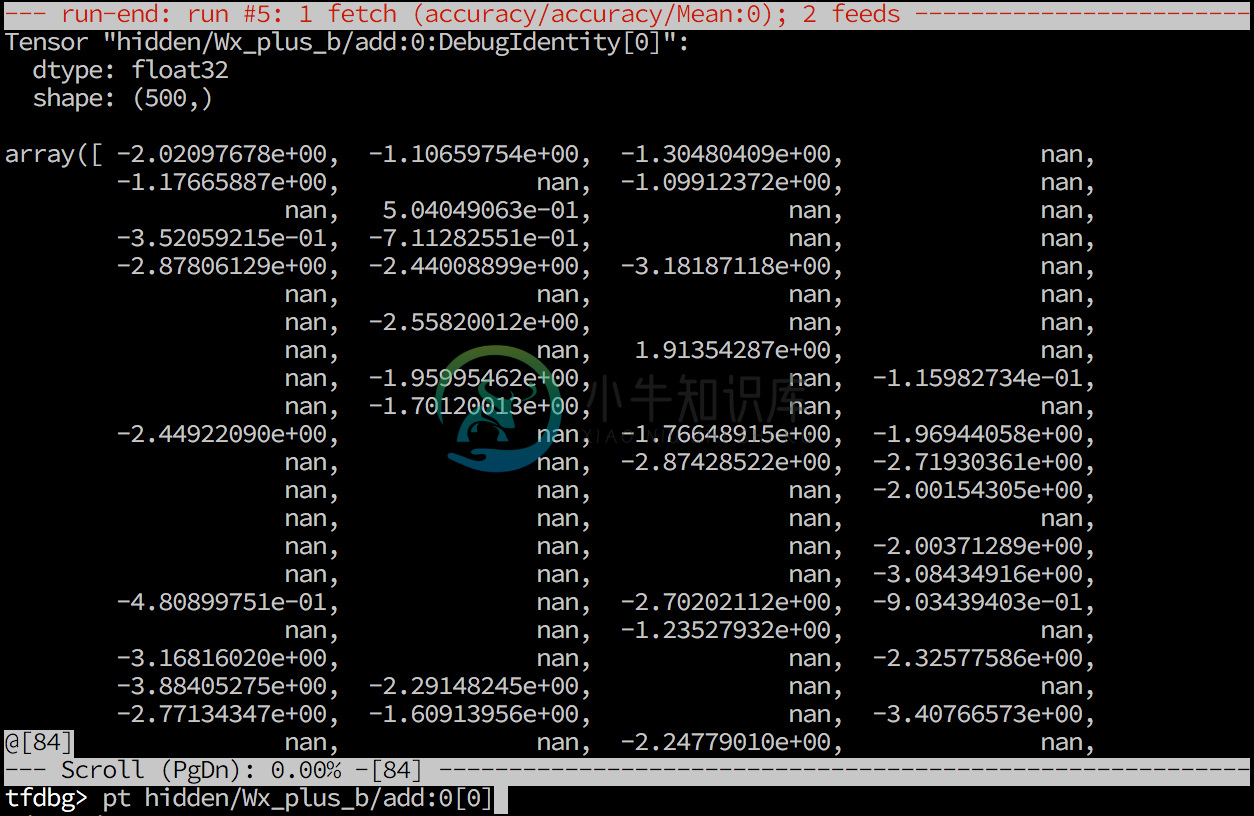
tfdbg: Tensor Fetching
Example: print_tensor fc2/Relu:0
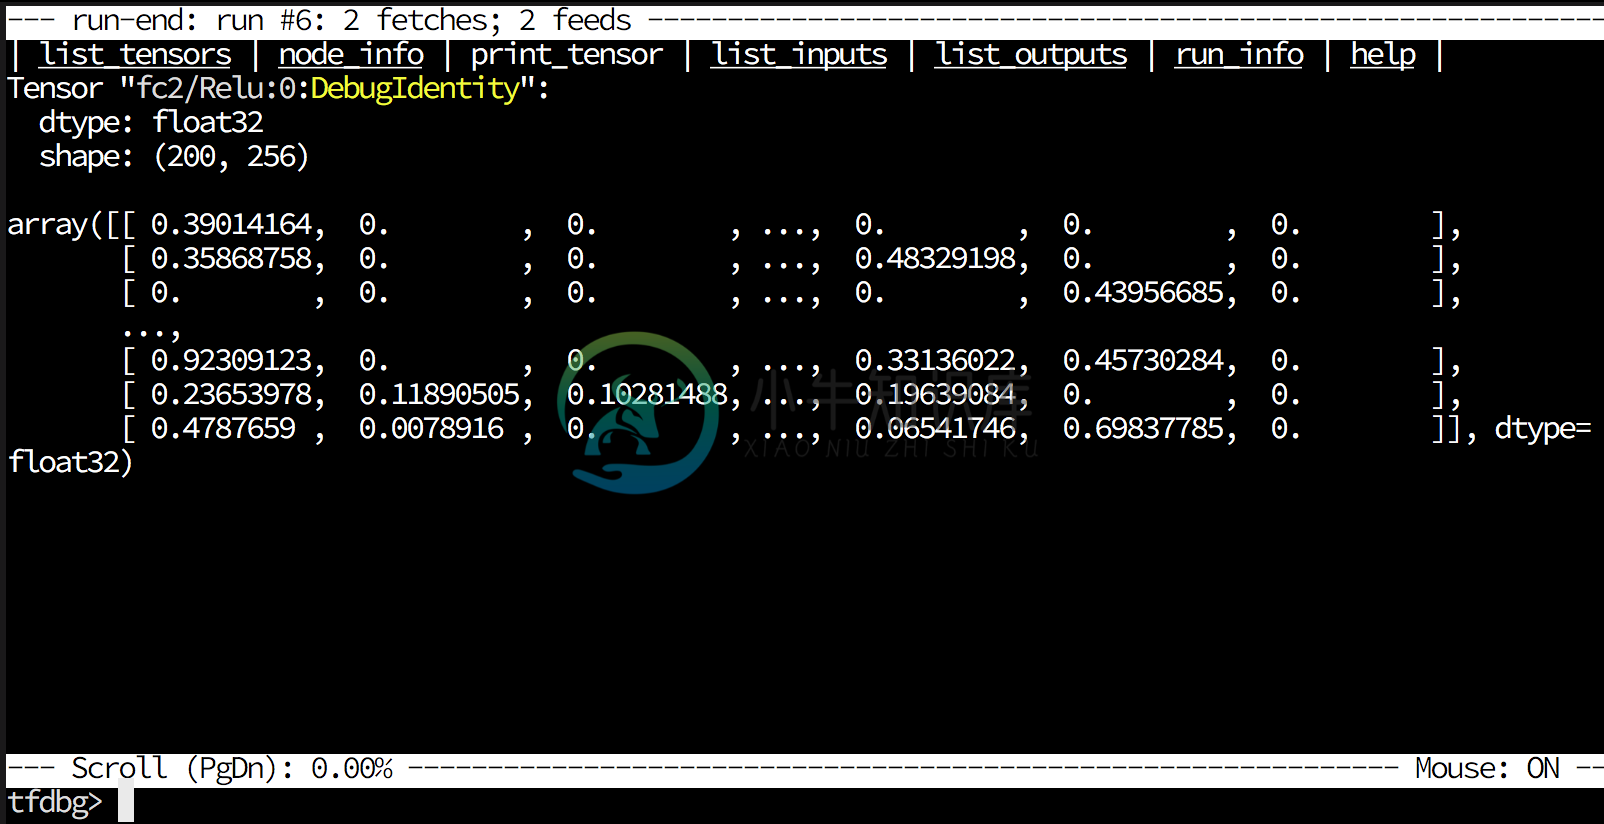
- Slicing:
pt f2/Relu:0[0:10] - Dumping:
pt fc2/Relu:0 > /tmp/debug/fc2.txt
See also: tfdbg CLI Frequently-Used Commands
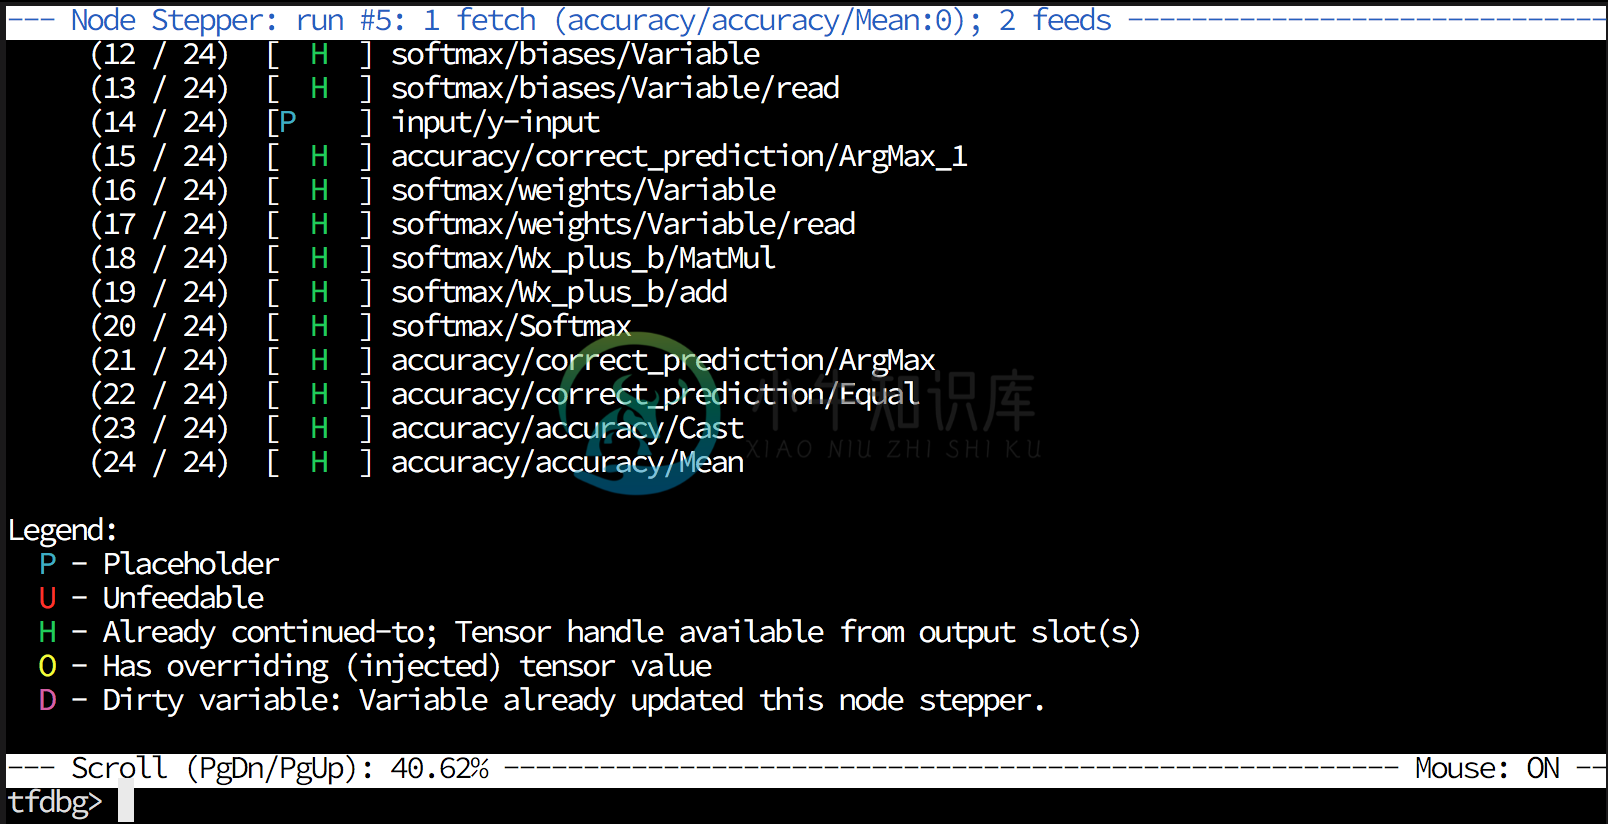
tfdbg: Stepper
Shows the tensor value(s) in a topologically-sorted order for the run.
tfdbg: Screencast and Demo!
From Google Brain Team
See also: Debug TensorFlow Models with tfdbg (@Google Developers Blog)
tfdbg: Other Remarks
- Currently it is actively being developed (still experimental)
- In a near future, a web-based interactive debugger (integration with TensorBoard) will be out!
Debugging: Summary
Session.run(): Explicitly fetch, and print- Tensorboard: Histogram and Image Summary
tf.Print(),tf.Assert()operation- Use python debugger (
ipdb,pudb) - Interpose your debugging python code in the graph
- The TensorFlow debugger:
tfdbg
There is no silver bullet; one might need to choose the most convenient and suitable debugging tool, depending on the case
Other General Tips
(in a Programmer's Perspective)
General Tips of Debugging
- Learn to use debugging tools, but do not solely rely on them when a problem occurs.
- Sometimes, just sitting down and reading through