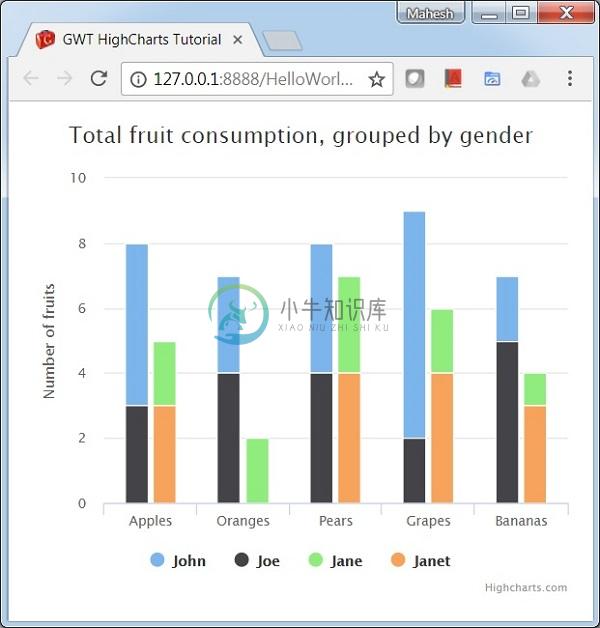
堆叠和分组列(Stacked and Grouped column)
以下是堆叠和分组柱形图的示例。
我们已经在Highcharts Configuration Syntax一章中看到了用于绘制图表的配置 。 现在让我们看一下其他配置,以及我们如何在plotoptions添加plotoptions属性。
下面给出了堆叠和分组柱形图的示例。
plotOptions
plotOptions是每个系列类型的配置对象的包装对象。 还可以为系列数组中给出的每个系列项覆盖每个系列的配置对象。 这是为了将每个系列的值叠加在一起。 这是为了将每个系列的值叠加在一起。
使用plotOptions.column.stacking配置图表的堆叠为“normal”。 可能的值为null,禁用堆叠,“正常”堆栈按值,“百分比”按百分比堆叠图表。
chart.setColumnPlotOptions(new ColumnPlotOptions()
   .setStacking(Stacking.NORMAL)
);
系列 (series)
配置每个系列的堆栈以标识系列组。
chart.addSeries(chart.createSeries()
   .setName("John")
   .setPoints(new Number[] {5, 3, 4, 7, 2})
   .setStack("male")
);
例子 (Example)
HelloWorld.java
package cn.xnip.client;
import org.moxieapps.gwt.highcharts.client.Chart;
import org.moxieapps.gwt.highcharts.client.Series.Type;
import org.moxieapps.gwt.highcharts.client.plotOptions.ColumnPlotOptions;
import org.moxieapps.gwt.highcharts.client.plotOptions.PlotOptions.Stacking;
import com.google.gwt.core.client.EntryPoint;
import com.google.gwt.user.client.ui.RootPanel;
public class HelloWorld implements EntryPoint {
   public void onModuleLoad() {
      final Chart chart = new Chart()
         .setType(Type.COLUMN)
         .setChartTitleText("Total fruit consumption, grouped by gender")
         .setColumnPlotOptions(new ColumnPlotOptions()
            .setStacking(Stacking.NORMAL)
         );
      chart.getXAxis()
         .setCategories("Apples", "Oranges", "Pears", "Grapes", "Bananas");
      chart.getYAxis()
         .setAllowDecimals(false)
         .setMin(0)
         .setAxisTitleText("Number of fruits");
      chart.addSeries(chart.createSeries()
         .setName("John")
         .setPoints(new Number[] {5, 3, 4, 7, 2})
         .setStack("male")
      );
      chart.addSeries(chart.createSeries()
         .setName("Joe")
         .setPoints(new Number[] {3, 4, 4, 2, 5})
         .setStack("male")
      );
      chart.addSeries(chart.createSeries()
         .setName("Jane")
         .setPoints(new Number[] {2, 2, 3, 2, 1})
         .setStack("female")
      );
      chart.addSeries(chart.createSeries()
         .setName("Janet")
         .setPoints(new Number[] {3, 0, 4, 4, 3})
         .setStack("female")
      );
      RootPanel.get().add(chart);
   }
}
结果 (Result)
验证结果。