Stacked Bar
优质
小牛编辑
147浏览
2023-12-01
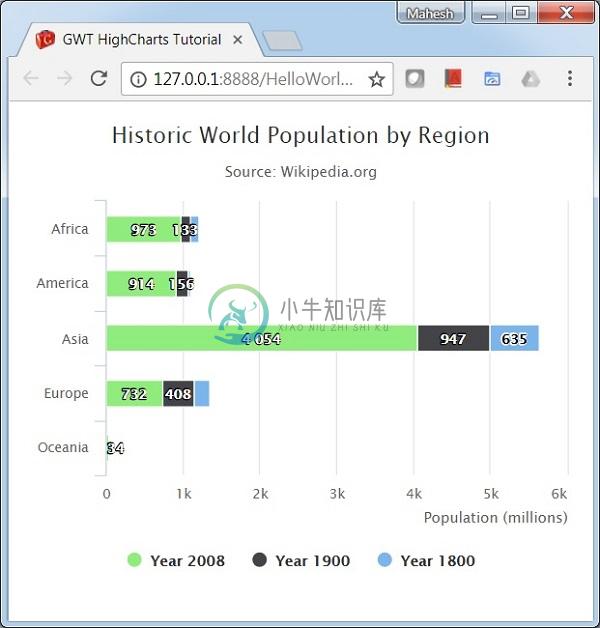
以下是堆积条形图的示例。
我们已经在Highcharts Configuration Syntax一章中看到了用于绘制图表的配置 。 现在,让我们看一个堆积条形图的示例。 我们还将了解其他配置。
plotOptions
使用plotOptions.series.stacking将图表的堆叠配置为“正常”。 可能的值为null,禁用堆叠,“正常”堆栈按值,“百分比”按百分比堆叠系列。
chart.setSeriesPlotOptions(new SeriesPlotOptions()
   .setStacking(Stacking.NORMAL)
)
例子 (Example)
HelloWorld.java
package cn.xnip.client;
import org.moxieapps.gwt.highcharts.client.AxisTitle;
import org.moxieapps.gwt.highcharts.client.Chart;
import org.moxieapps.gwt.highcharts.client.Credits;
import org.moxieapps.gwt.highcharts.client.Legend;
import org.moxieapps.gwt.highcharts.client.Series.Type;
import org.moxieapps.gwt.highcharts.client.ToolTip;
import org.moxieapps.gwt.highcharts.client.ToolTipData;
import org.moxieapps.gwt.highcharts.client.ToolTipFormatter;
import org.moxieapps.gwt.highcharts.client.labels.DataLabels;
import org.moxieapps.gwt.highcharts.client.plotOptions.BarPlotOptions;
import org.moxieapps.gwt.highcharts.client.plotOptions.SeriesPlotOptions;
import org.moxieapps.gwt.highcharts.client.plotOptions.PlotOptions.Stacking;
import com.google.gwt.core.client.EntryPoint;
import com.google.gwt.user.client.ui.RootPanel;
public class HelloWorld implements EntryPoint {
   public void onModuleLoad() {
      Chart chart = new Chart()
         .setType(Type.BAR)
         .setChartTitleText("Historic World Population by Region")
         .setChartSubtitleText("Source: Wikipedia.org")
         .setBarPlotOptions(new BarPlotOptions()
            .setDataLabels(new DataLabels()
               .setEnabled(true)
            )
         )
        .setSeriesPlotOptions(new SeriesPlotOptions()
            .setStacking(Stacking.NORMAL)
         )
         .setLegend(new Legend()
            .setBackgroundColor("#FFFFFF")
            .setReversed(true)
         )
         .setCredits(new Credits()
            .setEnabled(false)
         )
         .setToolTip(new ToolTip()
            .setFormatter(new ToolTipFormatter() {
               @Override
               public String format(ToolTipData toolTipData) {
                  return toolTipData.getSeriesName() + ": " + toolTipData.getYAsLong() +" million";
               }
         }));
         chart.getXAxis()
            .setCategories("Africa", "America", "Asia", "Europe", "Oceania");
         chart.getYAxis()
            .setAxisTitle(new AxisTitle()
               .setText("Population (millions)")
               .setAlign(AxisTitle.Align.HIGH)
            );
         chart.addSeries(chart.createSeries()
            .setName("Year 1800")
            .setPoints(new Number[] { 107, 31, 635, 203, 2 })
         );
         chart.addSeries(chart.createSeries()
            .setName("Year 1900")
            .setPoints(new Number[] { 133, 156, 947, 408, 6 })
         );
         chart.addSeries(chart.createSeries()
            .setName("Year 2008")
            .setPoints(new Number[] { 973, 914, 4054, 732, 34 })
         );
      RootPanel.get().add(chart);
   }
}
结果 (Result)
验证结果。


