ChartJs堆叠条形图
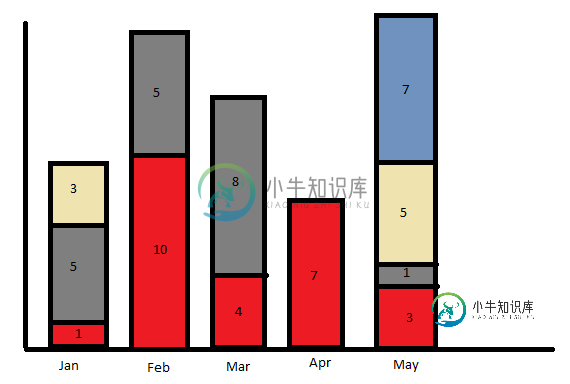
我有以下不同月份的数据
一月:[1,5,3]
Feb:[10,5]
三月:[4,8]
四月:[7]
可能:[3,1,5,0,7]
我想生成如下所示的条形图

现在,我有以下代码,我想知道如何生成如上图所示的条形图。
new Chart(document.getElementById("bar-chart"), {
type: 'bar',
data: {
  labels: ['Jan','Feb','Mar','Apr','May'],
  datasets: [{
      data: [1,5,3],
      label: 'Jan',
      backgroundColor: "#3e95cd",
    }
            , {
      data: [10,5],
      label: 'Feb',
      backgroundColor: "#8e5ea2",
    }, {
      data: [4,8],
      label: 'Mar',
      backgroundColor: "#4287f5",
    }
            , {
      data: [7],
      label: 'Apr',
      backgroundColor: "#23ebbc",
    }
            , {
      data: [3,1,5,0,7],
      label: 'May',
      backgroundColor: "#e63057",
    }
  ]
},
options: {
  title: {
    display: true,
    text: 'This is title'
  },
  backgroundColor:'#cfcfcf',
        scales: {
      xAxes: [{ stacked: true }],
      yAxes: [{ stacked: true }]
    }
}
});
非常感谢。
共有2个答案
我只使用过ChartJS一次,但根据您的需求判断,我假设您创建了一个条形图,并分别添加这些数据集。例如,数据集:[{data:yourRedData}]然后将其附加到图表中。
接缝,好像他们有一个你想要的例子,https://www.chartjs.org/samples/latest/charts/bar/stacked.html
我检查了示例的源代码,以便更好地了解它们是如何获得结果的,下面是我的发现。
var barChartData = {
        labels: ['January', 'February', 'March', 'April', 'May', 'June', 'July'],
        datasets: [{
            label: 'Dataset 1',
            backgroundColor: window.chartColors.red,
            data: [
                randomScalingFactor(),
                randomScalingFactor(),
                randomScalingFactor(),
                randomScalingFactor(),
                randomScalingFactor(),
                randomScalingFactor(),
                randomScalingFactor()
            ]
        }, {
            label: 'Dataset 2',
            backgroundColor: window.chartColors.blue,
            data: [
                randomScalingFactor(),
                randomScalingFactor(),
                randomScalingFactor(),
                randomScalingFactor(),
                randomScalingFactor(),
                randomScalingFactor(),
                randomScalingFactor()
            ]
        }, {
            label: 'Dataset 3',
            backgroundColor: window.chartColors.green,
            data: [
                randomScalingFactor(),
                randomScalingFactor(),
                randomScalingFactor(),
                randomScalingFactor(),
                randomScalingFactor(),
                randomScalingFactor(),
                randomScalingFactor()
            ]
        }]

    };
    window.onload = function() {
        var ctx = document.getElementById('canvas').getContext('2d');
        window.myBar = new Chart(ctx, {
            type: 'bar',
            data: barChartData,
            options: {
                title: {
                    display: true,
                    text: 'Chart.js Bar Chart - Stacked'
                },
                tooltips: {
                    mode: 'index',
                    intersect: false
                },
                responsive: true,
                scales: {
                    xAxes: [{
                        stacked: true,
                    }],
                    yAxes: [{
                        stacked: true
                    }]
                }
            }
        });
    };
第一个数据集是红色的[10,10,8,7,3],第二个数据集是[5,5,8,0,1],第三个数据集是[3,0,0,0,5],第四个数据集是[0,0,0,7]
当然,您必须使用自己的技能来转换web服务发送的数据。但这是你想要的最终结果。
-
我需要一张这样的图表: 我找到了这个示例,但它使用了旧版本的。我尝试使用v2.0,但我不明白。 有人能贴个例子吗?
-
我一直在寻找一种使用Chartjs绘制此图的方法,但没有成功。这在Chartjs中可能吗? 我想画的图表 我尝试的图表 以下是我的设置: 我知道如何设置堆叠条形图,只是不知道如何设置图像中的图例。任何帮助都很感激。提前感谢!
-
我正在尝试使用chartJs创建一个堆叠条形图(垂直或水平)。在遵循了他们的文档并尝试了各种解决方案之后,我仍然无法获得要叠加的值。 我创造了一把小提琴https://jsfiddle.net/trig79/oxantepu/1/ 感谢任何关于我哪里出错的指导
-
我正在尝试创建包含值的访客条形图,例如: 我想显示一个每日总访客的条形图,该条形图应包含总访客和首次访客的信息。 所以数据条应该看起来像: 我查看了chartjs文档,但只找到了具有堆叠值的示例,并且该解决方案不适用于我所需的设计,是否有人可以参考文档/文章/教程或个人经验,或者我应该切换到d3js?谢谢
-
我试图创建一个堆叠条形图与chartjs。我有时间差异的时间序列,这意味着一些序列可以在一段时间内有价值,但其他序列没有价值。出于这个原因,我选择直接将x值包含在数据集中,而不是作为标签数组,但是图表不能正确渲染。 这是我的代码: 我认为问题在于x轴堆叠。 这里有一个JSFiddle来说明这个问题。 https://jsfiddle.net/1kLyyjfp/
-
我需要一种在ChartJS中显示堆叠条形图中多个数据段的方法。在官方文档中,标签属于堆栈的每个部分,但我需要这些部分是独立的。 我已经模拟了我需要实现的输出类型。我们每天有三个堆叠的条,每个条显示一个单独的数据集。在每个数据集中,我们有一个段,它实际上是该条的子集。 不幸的是,中的属性似乎不接受数组。这个图表可以使用ChartJS吗?

