建立回归模型(Building a Regression Model)
Logistic回归是指机器学习算法,用于预测分类因变量的概率。 在逻辑回归中,因变量是二元变量,它由编码为1的数据组成(布尔值为true和false)。
在本章中,我们将重点介绍使用连续变量在Python中开发回归模型。 线性回归模型的示例将侧重于从CSV文件中进行数据探索。
分类目标是预测客户是否会订购(1/0)定期存款。
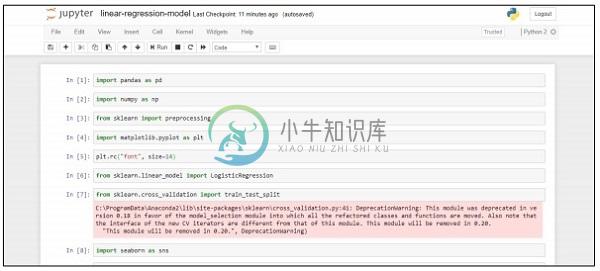
import pandas as pd
import numpy as np
from sklearn import preprocessing
import matplotlib.pyplot as plt
plt.rc("font", size=14)
from sklearn.linear_model import LogisticRegression
from sklearn.cross_validation import train_test_split
import seaborn as sns
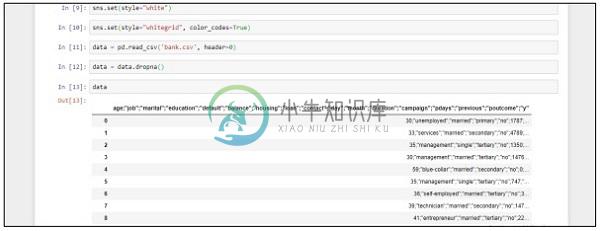
sns.set(style="white")
sns.set(style="whitegrid", color_codes=True)
data = pd.read_csv('bank.csv', header=0)
data = data.dropna()
print(data.shape)
print(list(data.columns))
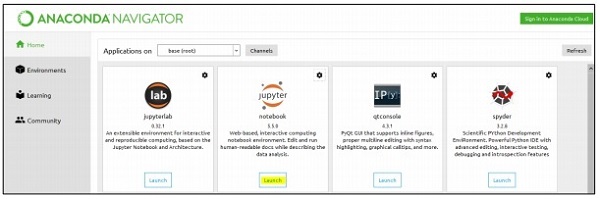
按照以下步骤在Anaconda Navigator中使用“Jupyter Notebook”实现上述代码 -
Step 1 - 使用Anaconda Navigator启动Jupyter笔记本。
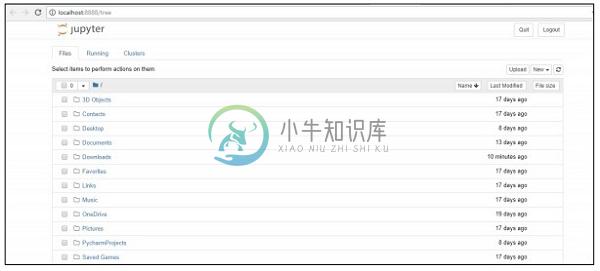
Step 2 - 上传csv文件以系统方式获得回归模型的输出。
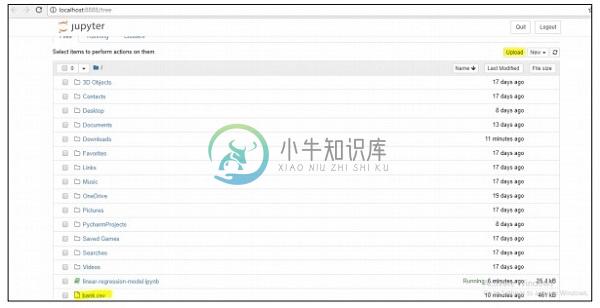
Step 3 - 创建一个新文件并执行上述代码行以获得所需的输出。