R语言炫技必备基本功

注意:本文中实际使用的样本数据是根据具体命令任意挑选某组样本数据,不具有针对性,因此自己试验可以随意找样本尝试
一个table引发的血案
table函数就是用来输出指定字段的统计表格,可以用来分析数据比例情况,像下面的样子:
> table(full$Title, full$Survived)
               0   1
  Master      17  23
  Miss        55 130
  Mr         436  81
  Mrs         26 100
  Rare Title  15   8
那么为了让table够直观,各路大侠纷纷使出了洪荒之力,注意,下面开始炫技部分:
第一种作图方式(用于观察标准残差的场景):
> mosaicplot(table(full$Title, full$Survived), shade=TRUE)
第二种作图方式(用于观察总数目的场景):
> barplot(table(full$Survived, full$Title), sub="Survival by Title", ylab="number of passengers", col=c("steelblue4","steelblue2"))
> legend("topleft",legend = c("Died","Survived"),fill=c("steelblue4","steelblue2"),inset = .05)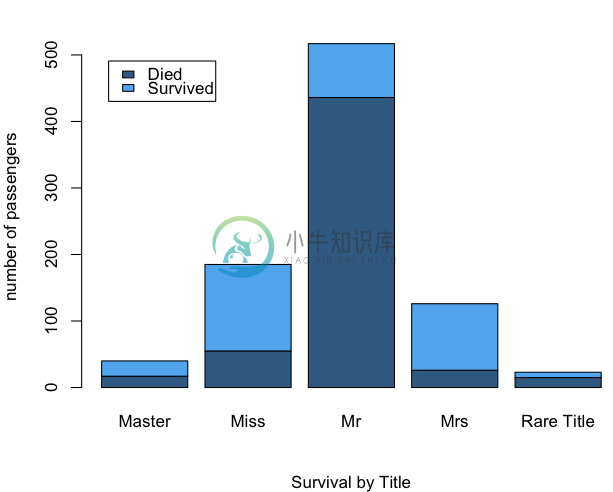
第三种作图方式(用于观察比例情况的场景):
> barplot(prop.table(table(full$Survived, full$Title),2), sub="Survival by Title", ylab="number of passengers", col=c("steelblue4","steelblue2"))
> legend("topleft",legend = c("Died","Survived"),fill=c("steelblue4","steelblue2"),inset = .05)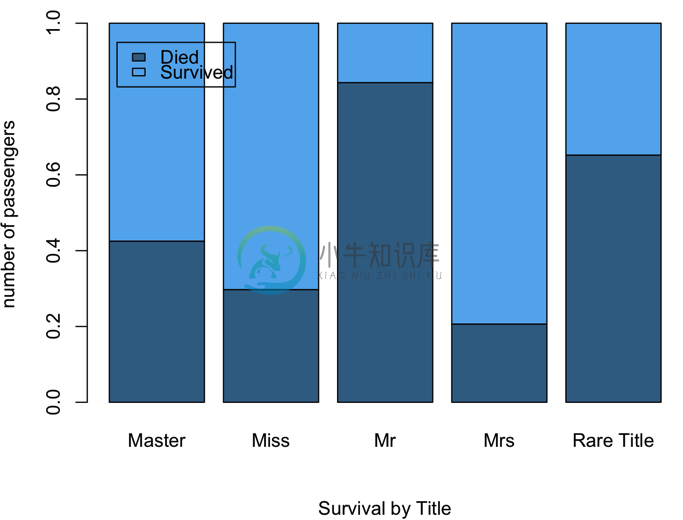
当然还可以有第四种作图方式(同样是用于观察比例情况的场景):
> library('ggthemes')
> ggplot(full, aes(x = Title, fill = factor(Survived))) + geom_bar(stat='count', position='fill') + theme_few()
不同风格的决策树
在上节数据缺失填补中我们见过这样一棵决策树:
> library("rpart")
> library("rpart.plot")
> my_tree <- rpart(Fare ~ Pclass + Fsize + Embarked, data = train, method = "class", control=rpart.control(cp=0.0001))
> prp(my_tree, type = 4, extra = 100)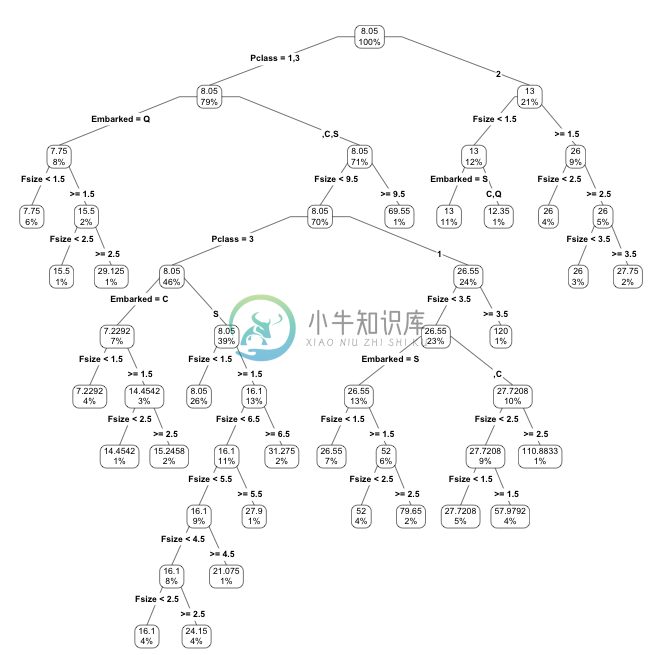
如果我们想看到每个分支的比例关系还可以在枝干上下文章:
> prp(my_tree, type = 2, extra = 100,branch.type=1)
图中根据不同的枝干粗细能看出样本集中在那个分支上
数据总览方式
第一种:按列总览
优点:可以看到有哪些列,什么类型,每一列取值举几个例子,也能看到有多少行
> str(train)
'data.frame':  	2197291 obs. of  15 variables:
 $ people_id        : chr  "ppl_100" "ppl_100" "ppl_100" "ppl_100" ...
 $ activity_id      : chr  "act2_1734928" "act2_2434093" "act2_3404049" "act2_3651215" ...
 $ date             : chr  "2023-08-26" "2022-09-27" "2022-09-27" "2023-08-04" ...
 $ activity_category: chr  "type 4" "type 2" "type 2" "type 2" ...
 $ char_1           : chr  "" "" "" "" ...
 $ char_2           : chr  "" "" "" "" ...
 $ char_3           : chr  "" "" "" "" ...
 $ char_4           : chr  "" "" "" "" ...
 $ char_5           : chr  "" "" "" "" ...
 $ char_6           : chr  "" "" "" "" ...
 $ char_7           : chr  "" "" "" "" ...
 $ char_8           : chr  "" "" "" "" ...
 $ char_9           : chr  "" "" "" "" ...
 $ char_10          : chr  "type 76" "type 1" "type 1" "type 1" ...
 $ outcome          : int  0 0 0 0 0 0 1 1 1 1 ...
第二种:分布总览
优点:能看出每一列的最大值、最小值、均值、中位数等分布数据
> summary(train)
comment_count      sex         has_free_course     score
 Min.   :   0.0        Min.   :0.0000   Min.   :0.0000        Min.   :0.00
 1st Qu.:   0.0        1st Qu.:0.0000   1st Qu.:0.0000        1st Qu.:0.00
 Median :   9.0        Median :1.0000   Median :0.0000        Median :4.90
 Mean   : 397.6        Mean   :0.6259   Mean   :0.3786        Mean   :2.92
 3rd Qu.: 169.0        3rd Qu.:1.0000   3rd Qu.:1.0000        3rd Qu.:5.00
 Max.   :5409.0        Max.   :2.0000   Max.   :1.0000        Max.   :5.00
第三种:采样浏览
优点:可以抽出其中少数样本看全部信息
> library(dplyr)
> sample_n(train, 4)
> sample_n(train, 4)
         people_id  activity_id       date activity_category char_1 char_2
513235  ppl_184793 act2_3805654 2023-02-25            type 2
1127284  ppl_29203 act2_1960547 2022-09-16            type 5
1174958 ppl_294918 act2_3624924 2022-10-19            type 3
1794311 ppl_390987  act2_633897 2023-02-10            type 2
        char_3 char_4 char_5 char_6 char_7 char_8 char_9   char_10 outcome
513235                                                      type 1       0
1127284                                                  type 1349       1
1174958                                                    type 23       0
1794311                                                     type 1       0
第四种:用户友好的表格采样浏览
优点:不自动换行,按表格形式组织,直观
> library(knitr)
> kable(sample_n(train, 4))
> kable(sample_n(train, 4))
people_id
activity_id
date
activity_category
char_1
char_2
char_3
char_4
char_5
char_6
char_7
char_8
char_9
char_10
outcome
1784154
ppl_389138
act2_2793972
2022-11-03
type 5
type 649
1
1138360
ppl_294144
act2_149226
2022-09-18
type 5
type 1058
0
1698603
ppl_373844
act2_3579388
2022-08-27
type 4
type 230
0
1505324
ppl_351017
act2_2570186
2022-09-30
type 5
type 248
0
R语言中的管道
shell中管道非常方便,比如把一个文件中第二列按数字排序后去重可以写成cat file | awk '{print $2}' | sort -n -k 1 | uniq,那么R语言中的管道怎么用呢?我们先来看一个例子:
> library(dplyr)
> ggplot(filter(train, char_5 != ""), aes(x = outcome, fill = char_5)) + geom_bar(width = 0.6, position = "fill")
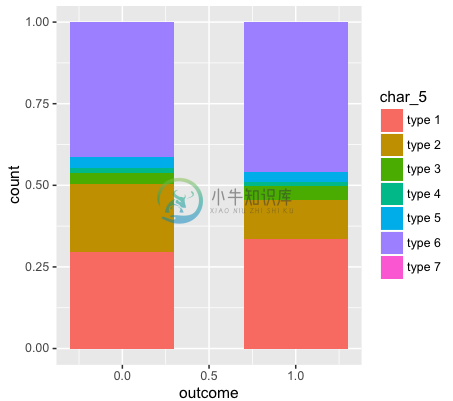
这个例子中有以下处理步骤:
1. 拿出train数据
2. 对train数据做过滤,过滤掉char_5这一列为空的样本
3. 用过滤好的数据执行ggplot画图
这三部如果用一层层管道操作就方便多了,实际上R语言为我们提供了这样的管道,即把函数的第一个参数单独提出来作为管道输入,管道操作符是%>%,也就是可以这样执行:
> train %>%
+ filter(char_5 != "") %>%
+ ggplot(aes(x=outcome, fill=char_10))+geom_bar(width=0.6, position="fill")
那么管道到底有什么好处呢?我们来追踪一下实际的过程来体会
假设我们样本长这个样子:
> library(knitr)
> kable(sample_n(train, 4))
people_id
activity_id
date
activity_category
char_1
char_2
char_3
char_4
char_5
char_6
char_7
char_8
char_9
char_10
outcome
567545
ppl_194099
act2_1420548
2023-02-08
type 2
type 1
0
115164
ppl_112033
act2_2209862
2022-10-23
type 5
type 481
1
1616290
ppl_369463
act2_2515098
2023-07-11
type 4
type 295
0
1714893
ppl_376799
act2_1464019
2022-10-01
type 5
type 1907
0
这时我们发现有一些列是空值,如果我希望了解一下其中的char_5都有哪些取值以及比例情况,我们可以这样来做:
> train %>%
+ count(char_5)
# A tibble: 8 × 2
char_5 n
<chr> <int>
1 2039676
2 type 1 49214
3 type 2 26982
4 type 3 6013
5 type 4 1995
6 type 5 5421
7 type 6 67989
8 type 7 1
现在我们看到了输出了char_5和n两列分别表示可能取值和频次,但是还是不够直观,希望画图来看,那么我们继续:
> train %>%
+ count(char_5) %>%
+ ggplot(aes (x = reorder(char_5,n), y = n)) +
+ geom_bar(stat = "identity", fill = "light blue")
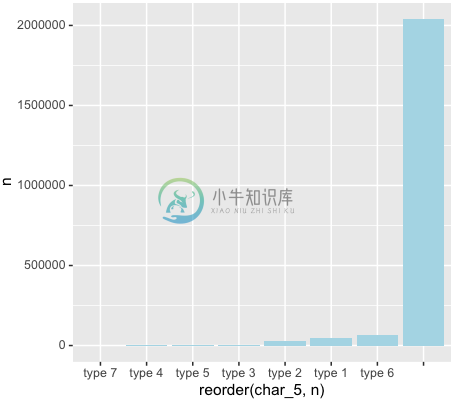
发现我们有很多空值,这时我们继续调整:
> train %>%
+ filter(char_5!="") %>%
+ count(char_5) %>%
+ ggplot(aes (x = reorder(char_5,n), y = n)) +
+ geom_bar(stat = "identity", fill = "light blue")
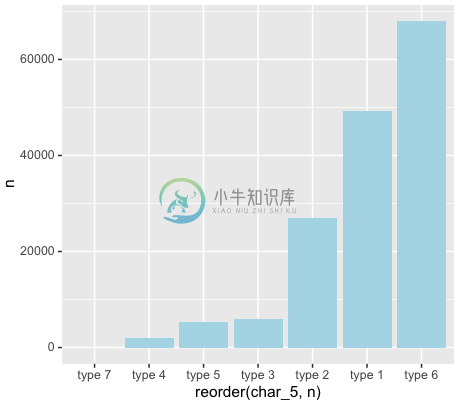
这就是我们的管道的作用:一步一步调试,不需要总想着把参数插到函数的哪个位置
回到本源,最基本的作图
有人会说,R语言怎么总是画这么复杂的图像,但是却连最基本的散点图和折线图都不能画吗?下面回到本源,来展示一下R语言的最基本的作图功能。
散点图
> a <- c(49, 26, 69, 19, 54, 67, 19, 33)
> plot(a)
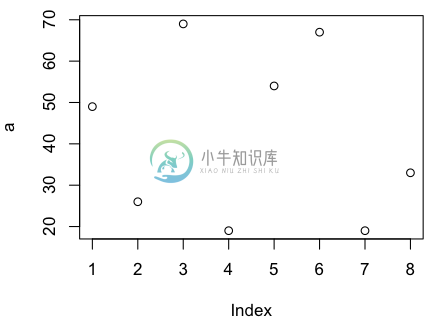
如果希望看到变化趋势,我们可以画折线图,加上type即可
> plot(a, type='b')
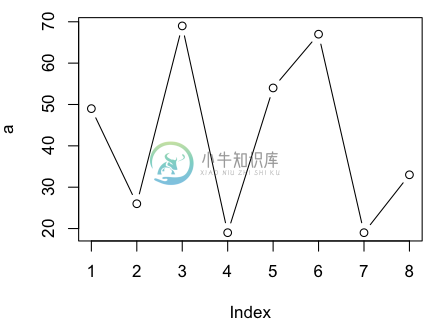
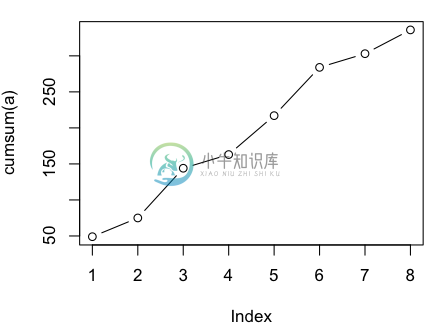
如果这是一个每日消费金额,我们想看累积消费怎么办?我们可以利用累积函数cumsum,它的功能像这个样子:
> a
[1] 49 26 69 19 54 67 19 33
> cumsum(a)
[1] 49 75 144 163 217 284 303 336
>
那么可以这样作图:
> plot(cumsum(a), type='b')
最后让我们用一个完美的正弦曲线收笔:
> x1 <- 0:100
> x2 <- x1 * 2 * pi / 100
> Y = sin(x2)
> par(family='STXihei') # 这句是为了解决图像中中文乱码问题
> plot(x2, Y, type='l', main='正弦曲线', xlab='x轴', ylab='y轴')


