JFreeChart 饼图
精华
小牛编辑
218浏览
2023-03-14
什么是JFreeChart 饼图
饼图是一个圆形图,它被分成多个扇区,其中每个扇区的面积代表数据的大小。
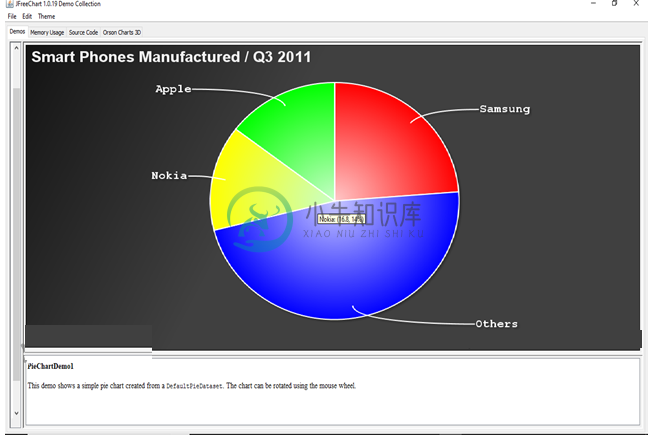
下图显示了 JFreeChart 库中包含的饼图的一些演示版本:

JFreeChart 饼图的示例
让我们以学生的考试分数分布作为样本数据。
| 成绩范围 | 学生人数 |
|---|---|
| 80-100 | 120 |
| 60-79 | 80 |
| 40-59 | 20 |
| 20-39 | 7 |
| 0-19 | 3 |
以下代码根据上述示例数据创建饼图:
package cn.xnip;

import javafx.scene.chart.Chart;
import org.jfree.chart.ChartFactory;
import org.jfree.chart.ChartPanel;
import org.jfree.chart.JFreeChart;
import org.jfree.chart.labels.PieSectionLabelGenerator;
import org.jfree.chart.labels.StandardPieSectionLabelGenerator;
import org.jfree.chart.plot.PiePlot;
import org.jfree.data.general.DefaultPieDataset;
import org.jfree.data.general.PieDataset;

import javax.swing.*;
import java.text.DecimalFormat;

public class PieChartExample extends JFrame {
  private static final long serialVersionUID = 6294689542092367723L;

  public PieChartExample(String title) {
    super(title);

    // Create dataset
    PieDataset dataset = createDataset();

    // Create chart
    JFreeChart chart = ChartFactory.createPieChart(
        "Pie Chart Example",
        dataset,
        true,
        true,
        false);

    //Format Label
    PieSectionLabelGenerator labelGenerator = new StandardPieSectionLabelGenerator(
        "Marks {0} : ({2})", new DecimalFormat("0"), new DecimalFormat("0%"));
    ((PiePlot) chart.getPlot()).setLabelGenerator(labelGenerator);

    // Create Panel
    ChartPanel panel = new ChartPanel(chart);
    setContentPane(panel);
  }

  private PieDataset createDataset() {

    DefaultPieDataset dataset=new DefaultPieDataset();
    dataset.setValue("80-100", 120);
    dataset.setValue("60-79", 80);
    dataset.setValue("40-59", 20);
    dataset.setValue("20-39", 7);
    dataset.setValue("0-19", 3);
    return dataset;
  }

  public static void main(String[] args) {
    SwingUtilities.invokeLater(() -> {
      PieChartExample example = new PieChartExample("小牛知识库网:PieChart Example");
      example.setSize(800, 400);
      example.setLocationRelativeTo(null);
      example.setDefaultCloseOperation(WindowConstants.EXIT_ON_CLOSE);
      example.setVisible(true);
    });
  }
}
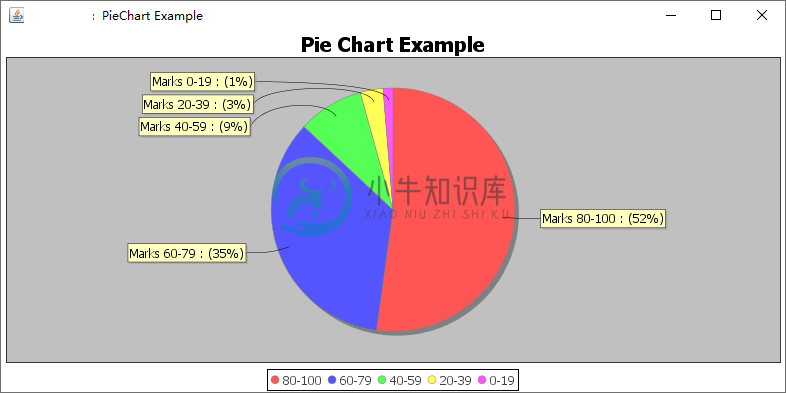
输出结果为:

