ECharts 样式设置
精华
小牛编辑
193浏览
2023-03-14
ECharts 可以通过样式设置来改变图形元素或者文字的颜色、明暗、大小等。
颜色主题
ECharts4 开始,除了默认主题外,内置了两套主题,分别为 light 和 dark。
使用方式如下:
实例
var chart = echarts.init(dom, 'light');
或者
var chart = echarts.init(dom, 'dark');
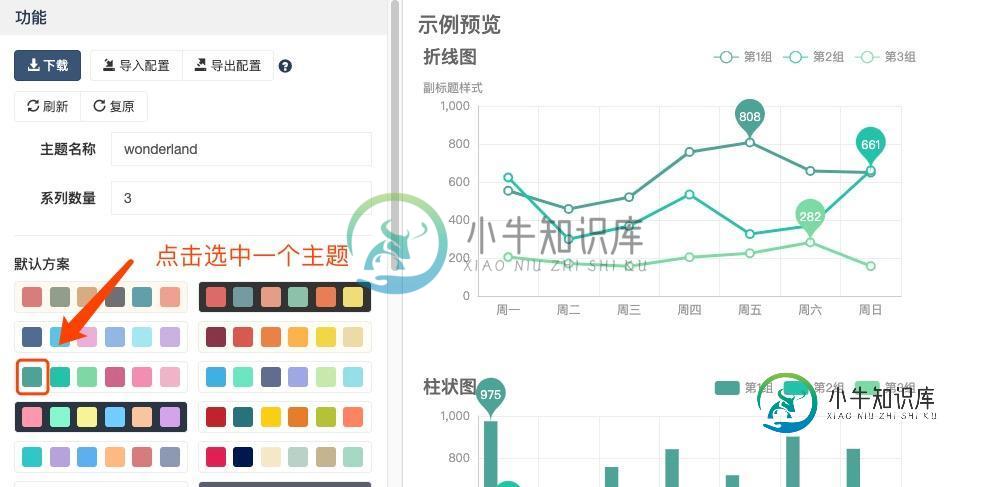
另外,我们也可以在官方的 主题编辑器 选择自己喜欢的主题下载。

目前主题下载提供了 JS 版本和 JSON 版本。
如果你使用 JS 版本,可以将 JS 主题代码保存一个 主题名.js 文件,然后在 HTML 中引用该文件,最后在代码中使用该主题。
比如上图中我们选中了一个主题,将 JS 代码保存为 wonderland.js。
实例
<!-- 引入主题 --
>
<script src= "https://www.xnip.cn/static/js/wonderland.js" ></script >
...
// HTML 引入 wonderland.js 文件后,在初始化的时候调用
var myChart = echarts.init (dom, 'wonderland' );
// ...
<script src= "https://www.xnip.cn/static/js/wonderland.js" ></script >
...
// HTML 引入 wonderland.js 文件后,在初始化的时候调用
var myChart = echarts.init (dom, 'wonderland' );
// ...
如果主题保存为 JSON 文件,那么可以自行加载和注册。
比如上图中我们选中了一个主题,将 JSON 代码保存为 wonderland.json。
实例
//主题名称是 wonderland
$.getJSON ( 'wonderland.json', function (themeJSON ) {
echarts.registerTheme ( 'wonderland', themeJSON )
var myChart = echarts.init (dom, 'wonderland' );
} );
$.getJSON ( 'wonderland.json', function (themeJSON ) {
echarts.registerTheme ( 'wonderland', themeJSON )
var myChart = echarts.init (dom, 'wonderland' );
} );
注意:我们使用了 $.getJSON,所以需要引入 jQuery。
调色盘
调色盘可以在 option 中设置。
调色盘给定了一组颜色,图形、系列会自动从其中选择颜色。
可以设置全局的调色盘,也可以设置系列自己专属的调色盘。
option
=
{
// 全局调色盘。
color : [ '#c23531' , '#2f4554' , '#61a0a8' , '#d48265' , '#91c7ae' , '#749f83' , '#ca8622' , '#bda29a' , '#6e7074' , '#546570' , '#c4ccd3' ] ,
series : [ {
type : 'bar' ,
// 此系列自己的调色盘。
color : [ '#dd6b66' , '#759aa0' , '#e69d87' , '#8dc1a9' , '#ea7e53' , '#eedd78' , '#73a373' , '#73b9bc' , '#7289ab' , '#91ca8c' , '#f49f42' ] ,
...
} , {
type : 'pie' ,
// 此系列自己的调色盘。
color : [ '#37A2DA' , '#32C5E9' , '#67E0E3' , '#9FE6B8' , '#FFDB5C' , '#ff9f7f' , '#fb7293' , '#E062AE' , '#E690D1' , '#e7bcf3' , '#9d96f5' , '#8378EA' , '#96BFFF' ] ,
...
} ]
}
全局调色盘实例:
实例
// 全局调色盘。
color : [ '#ff0000' , '#00ff00' , '#0000ff' , '#d48265' , '#91c7ae' , '#749f83' , '#ca8622' , '#bda29a' , '#6e7074' , '#546570' , '#c4ccd3' ] ,
color : [ '#ff0000' , '#00ff00' , '#0000ff' , '#d48265' , '#91c7ae' , '#749f83' , '#ca8622' , '#bda29a' , '#6e7074' , '#546570' , '#c4ccd3' ] ,
系列调色盘实例:
实例
series
:
[
{
type : 'pie' ,
// 此系列自己的调色盘。
color : [ '#ff0000' , '#00ff00' , '#0000ff' , '#9FE6B8' , '#FFDB5C' , '#ff9f7f' , '#fb7293' , '#E062AE' , '#E690D1' , '#e7bcf3' , '#9d96f5' , '#8378EA' , '#96BFFF' ] ,
...
} ]
type : 'pie' ,
// 此系列自己的调色盘。
color : [ '#ff0000' , '#00ff00' , '#0000ff' , '#9FE6B8' , '#FFDB5C' , '#ff9f7f' , '#fb7293' , '#E062AE' , '#E690D1' , '#e7bcf3' , '#9d96f5' , '#8378EA' , '#96BFFF' ] ,
...
} ]
直接的样式设置 itemStyle, lineStyle, areaStyle, label, ...
直接的样式设置是比较常用设置方式。纵观 ECharts 的 option 中,很多地方可以设置 itemStyle、lineStyle、areaStyle、label 等等。这些的地方可以直接设置图形元素的颜色、线宽、点的大小、标签的文字、标签的样式等等。
一般来说,ECharts 的各个系列和组件,都遵从这些命名习惯,虽然不同图表和组件中,itemStyle、label 等可能出现在不同的地方。
直接样式设置的另一篇介绍,参见 ECharts 饼图。
高亮的样式:emphasis
在鼠标悬浮到图形元素上时,一般会出现高亮的样式。默认情况下,高亮的样式是根据普通样式自动生成的。
如果要自定义高亮样式可以通过 emphasis 属性来定制:
实例
// 高亮样式。
emphasis : {
itemStyle : {
// 高亮时点的颜色
color : 'red'
} ,
label : {
show : true ,
// 高亮时标签的文字
formatter : '高亮时显示的标签内容'
}
} ,
emphasis : {
itemStyle : {
// 高亮时点的颜色
color : 'red'
} ,
label : {
show : true ,
// 高亮时标签的文字
formatter : '高亮时显示的标签内容'
}
} ,
