
使用scipy.signal.spectrogram在pyqtgraph中绘制wav文件的频谱

我有一个用于音乐和语音分析的PyQt plus pyqtgraph程序,我想绘制一个wav文件的频谱(使用scipy
python软件包计算)。我可以在matplotlib中做到这一点,但是由于matplotlib的性能,我需要切换到pyqtgraph,但是我找不到任何一致的方法来将scipy.signal.spectrogram的输出绘制到pyqtgraph中
谢谢!
问题答案:
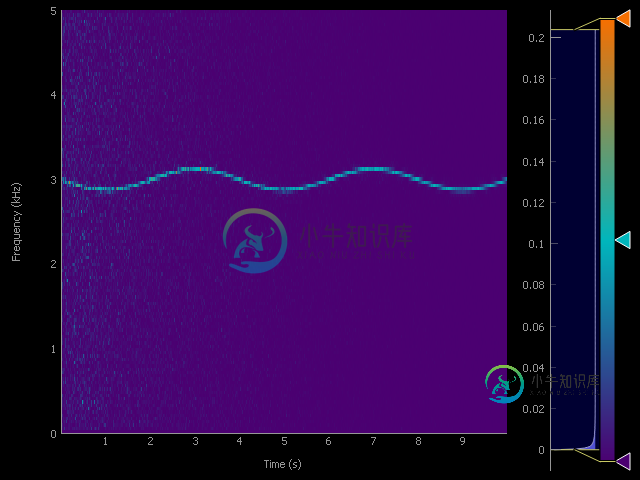
Scipy频谱图的输出可以很容易地从pyqtgraph绘制为ImageItem。通常,所得频谱图仅是灰度的。您可以使用直方图最轻松地进行调整。
例如,以下是如何使SciPy示例适用于声谱图以使用pyqtgraph(以pyqtgraph中的示例为基础):
from scipy import signal
import matplotlib.pyplot as plt
import numpy as np
import pyqtgraph
# Create the data
fs = 10e3
N = 1e5
amp = 2 * np.sqrt(2)
noise_power = 0.01 * fs / 2
time = np.arange(N) / float(fs)
mod = 500*np.cos(2*np.pi*0.25*time)
carrier = amp * np.sin(2*np.pi*3e3*time + mod)
noise = np.random.normal(scale=np.sqrt(noise_power), size=time.shape)
noise *= np.exp(-time/5)
x = carrier + noise
f, t, Sxx = signal.spectrogram(x, fs)
# Interpret image data as row-major instead of col-major
pyqtgraph.setConfigOptions(imageAxisOrder='row-major')
pyqtgraph.mkQApp()
win = pyqtgraph.GraphicsLayoutWidget()
# A plot area (ViewBox + axes) for displaying the image
p1 = win.addPlot()
# Item for displaying image data
img = pyqtgraph.ImageItem()
p1.addItem(img)
# Add a histogram with which to control the gradient of the image
hist = pyqtgraph.HistogramLUTItem()
# Link the histogram to the image
hist.setImageItem(img)
# If you don't add the histogram to the window, it stays invisible, but I find it useful.
win.addItem(hist)
# Show the window
win.show()
# Fit the min and max levels of the histogram to the data available
hist.setLevels(np.min(Sxx), np.max(Sxx))
# This gradient is roughly comparable to the gradient used by Matplotlib
# You can adjust it and then save it using hist.gradient.saveState()
hist.gradient.restoreState(
{'mode': 'rgb',
'ticks': [(0.5, (0, 182, 188, 255)),
(1.0, (246, 111, 0, 255)),
(0.0, (75, 0, 113, 255))]})
# Sxx contains the amplitude for each pixel
img.setImage(Sxx)
# Scale the X and Y Axis to time and frequency (standard is pixels)
img.scale(t[-1]/np.size(Sxx, axis=1),
f[-1]/np.size(Sxx, axis=0))
# Limit panning/zooming to the spectrogram
p1.setLimits(xMin=0, xMax=t[-1], yMin=0, yMax=f[-1])
# Add labels to the axis
p1.setLabel('bottom', "Time", units='s')
# If you include the units, Pyqtgraph automatically scales the axis and adjusts the SI prefix (in this case kHz)
p1.setLabel('left', "Frequency", units='Hz')
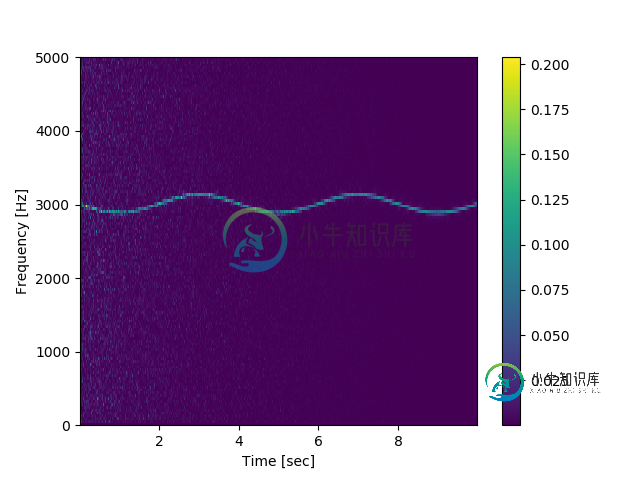
# Plotting with Matplotlib in comparison
plt.pcolormesh(t, f, Sxx)
plt.ylabel('Frequency [Hz]')
plt.xlabel('Time [sec]')
plt.colorbar()
plt.show()
pyqtgraph.Qt.QtGui.QApplication.instance().exec_()
Matpotlib频谱图
Pyqtgraph ImageItem
-
我正在读一本书。wav文件在C中,然后我尝试使用一些QT函数播放音频文件。以下是我如何阅读该文件: 所以我的音频文件在里面。的每个元素都是无符号的16位整数。 为了播放声音,我将每个16位无符号整数分成两个字符,然后每隔3毫秒(使用计时器)向音频卡发送256个字符。假设是256个字符的字符数组,我这样做(每隔3毫秒)来播放声音: 此外,定义为: 并且定义为: 并且音频格式设置正确为: 然而,当我试
-
本文向大家介绍java读取wav文件(波形文件)并绘制波形图的方法,包括了java读取wav文件(波形文件)并绘制波形图的方法的使用技巧和注意事项,需要的朋友参考一下 本文实例讲述了java读取wav文件(波形文件)并绘制波形图的方法。分享给大家供大家参考。具体如下: 因为最近有不少网友询问我波形文件读写方面的问题,出于让大家更方便以及让代码能够得到更好的改进,我将这部分(波形文件的读写)代码开源
-
问题内容: 嗨,我需要将wav音频文件的采样率从44.1kHz下采样到8kHz。我必须使用字节数组手动完成所有工作…这是出于学术目的。 我目前正在使用2个类(接收器和源)来弹出和推送字节数组。一切顺利,直到到达需要使用线性插值对数据块进行下采样的部分为止。 由于我是从44100降采样到8000 Hz,因此我该如何插入一个包含约128000000字节的字节数组?现在,我弹出5、6或7个字节,具体取决
-
本文向大家介绍delphi制作wav文件的方法,包括了delphi制作wav文件的方法的使用技巧和注意事项,需要的朋友参考一下 本文实例讲述了delphi制作wav文件的方法。分享给大家供大家参考。具体如下: 这里delphi用waveIn...函数制作wav文件 具体代码如下: 希望本文所述对大家的Delphi程序设计有所帮助。
-
我试着做一个*。使用pyqtgraph的python应用程序中的exe文件和使用pyinstaller的pyqt库。Pyinstaller生成单个*。exe文件没有错误,但当我尝试启动它时,我得到一个未找到pyqtgraph的错误。 如何构建单个*。使用pyinstaller的exe文件?
-
本文向大家介绍使用PyQtGraph绘制精美的股票行情K线图的示例代码,包括了使用PyQtGraph绘制精美的股票行情K线图的示例代码的使用技巧和注意事项,需要的朋友参考一下 pyqtgraph是Python平台上一种功能强大的2D/3D绘图库,相对于matplotlib库,由于其在内部实现方式上,使用了高速计算的numpy信号处理库以及Qt的GraphicsView框架,因此它在大数据量的处理及