ElasticSearch
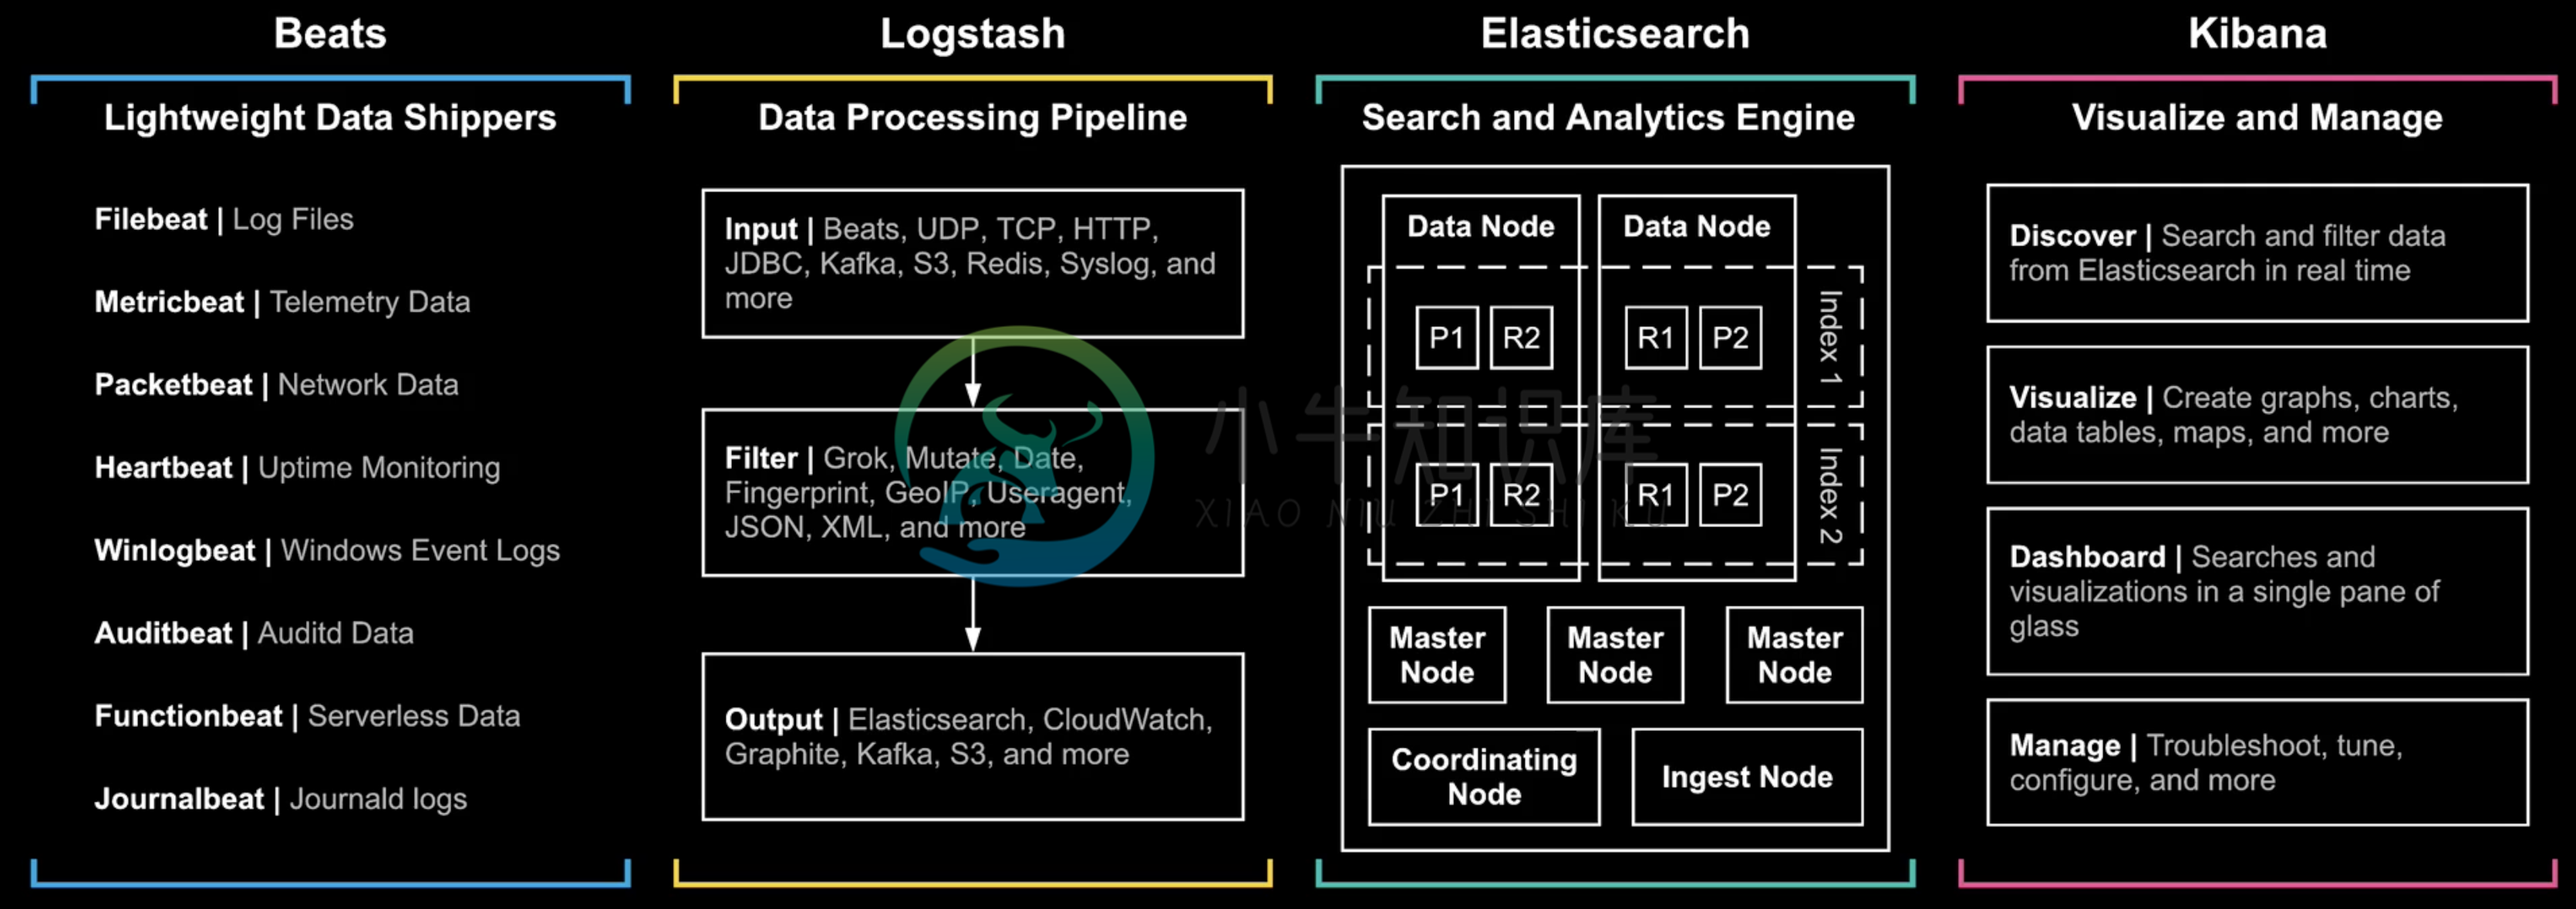
Elastic Stack Overview
多节点 Elasticsearch 集群部署
RPM 安装
1. 环境准备(1 master/ingress node, 2 data node)// 2 data node, 1 master/ingress node
$ for i in master data01 data02 ; do ssh $i.mylabserver.com 'hostname' ; done
master.mylabserver.com
data01.mylabserver.com
data02.mylabserver.com
// os version
$ for i in master data01 data02 ; do ssh $i.mylabserver.com 'cat /etc/redhat-release' ; done
CentOS Linux release 7.7.1908 (Core)
CentOS Linux release 7.7.1908 (Core)
CentOS Linux release 7.7.1908 (Core)// import PGP key
rpm --import https://artifacts.elastic.co/GPG-KEY-elasticsearch
// yum repo
cat << EOF > /etc/yum.repos.d/elastic.repo
[elasticsearch]
name=Elasticsearch repository for 7.x packages
baseurl=https://artifacts.elastic.co/packages/7.x/yum
gpgcheck=1
gpgkey=https://artifacts.elastic.co/GPG-KEY-elasticsearch
enabled=0
autorefresh=1
type=rpm-md
EOFyum install --enablerepo=elasticsearch elasticsearch -y
systemctl enable elasticsearch.service配置 & 启动
依此编辑三个节点的 /etc/elasticsearch/elasticsearch.yml 文件,添加配置属性
cluster.name: playground
node.name: master
network.host: [_local_, _site_]
discovery.seed_hosts: ["172.31.25.64"]
cluster.initial_master_nodes: ["master"]
node.master: true
node.data: false
node.ingest: true
node.ml: false| Note | discovery.seed_hosts is the master ip address, if multiple master node exists, there should multiple ip addresses. |
cluster.name: playground
node.name: data-1
network.host: [_local_, _site_]
discovery.seed_hosts: ["172.31.25.64"]
cluster.initial_master_nodes: ["master"]
node.master: false
node.data: true
node.ingest: false
node.ml: falsecluster.name: playground
node.name: data-2
network.host: [_local_, _site_]
discovery.seed_hosts: ["172.31.25.64"]
cluster.initial_master_nodes: ["master"]
node.master: false
node.data: true
node.ingest: false
node.ml: falsesystemctl start elasticsearch && systemctl status elasticsearch安装验证
1. master 节点查看日志(/var/log/elasticsearch/playground.log),可以看到三个节点加入的信息[2020-03-27T15:38:37,516][INFO ][o.e.x.s.s.SecurityStatusChangeListener] [master] Active license is now [BASIC]; Security is disabled
[2020-03-27T15:39:56,902][INFO ][o.e.c.s.ClusterApplierService] [master] added {data-2}{nFF-A9j8QqOq3nKQOOBUDw}{AoJBUFO-Q4ibPcZMiLRi0A}{172.31.20.222}{172.31.20.222:9300}{d}{xpack.installed=true}, term: 1, version: 20, reason: Publication{term=1, version=20}
[2020-03-27T15:40:49,004][INFO ][o.e.c.s.ClusterApplierService] [master] added {data-1}{6UVMCBvOQTyGw1Cv4wjG-Q}{AZ3edTN1T-24NpSLySu5Yg}{172.31.17.25}{172.31.17.25:9300}{d}{xpack.installed=true}, term: 1, version: 21, reason: Publication{term=1, version=21}$ curl localhost:9200
{
"name" : "master",
"cluster_name" : "playground",
"cluster_uuid" : "KU518MG4TfyAnSAa7P-4QQ",
"version" : {
"number" : "7.6.1",
"build_flavor" : "default",
"build_type" : "rpm",
"build_hash" : "aa751e09be0a5072e8570670309b1f12348f023b",
"build_date" : "2020-02-29T00:15:25.529771Z",
"build_snapshot" : false,
"lucene_version" : "8.4.0",
"minimum_wire_compatibility_version" : "6.8.0",
"minimum_index_compatibility_version" : "6.0.0-beta1"
},
"tagline" : "You Know, for Search"
}$ curl localhost:9200/_cat
=^.^=
/_cat/allocation
/_cat/shards
/_cat/shards/{index}
/_cat/master
/_cat/nodes
/_cat/tasks
/_cat/indices
/_cat/indices/{index}
/_cat/segments
/_cat/segments/{index}
/_cat/count
/_cat/count/{index}
/_cat/recovery
/_cat/recovery/{index}
/_cat/health
/_cat/pending_tasks
/_cat/aliases
/_cat/aliases/{alias}
/_cat/thread_pool
/_cat/thread_pool/{thread_pools}
/_cat/plugins
/_cat/fielddata
/_cat/fielddata/{fields}
/_cat/nodeattrs
/_cat/repositories
/_cat/snapshots/{repository}
/_cat/templates$ curl localhost:9200/_cat/nodes?v
ip heap.percent ram.percent cpu load_1m load_5m load_15m node.role master name
172.31.20.222 12 97 0 0.00 0.01 0.05 d - data-2
172.31.25.64 11 97 1 0.00 0.02 0.05 im * master
172.31.17.25 10 96 0 0.01 0.03 0.05 d - data-1Elasticsearch 集群安全加固
创建证书
1. 三个节点上创建 certs 目录mkdir /etc/elasticsearch/certs/usr/share/elasticsearch/bin/elasticsearch-certutil cert --name playground --out /etc/elasticsearch/certs/playground
ls -l /etc/elasticsearch/certs/for i in 1 2 ; do scp /etc/elasticsearch/certs/playground root@data0$i.mylabserver.com:/etc/elasticsearch/certs ; donechmod 640 /etc/elasticsearch/certs/playground && ls -l /etc/elasticsearch/certs/playgroundElasticsearch 安全插件及传输加密
1. 3 个节点上编辑/etc/elasticsearch/elasticsearch.yml,添加如下安全配置xpack.security.enabled: true
xpack.security.transport.ssl.enabled: true
xpack.security.transport.ssl.verification_mode: certificate
xpack.security.transport.ssl.keystore.path: certs/playground
xpack.security.transport.ssl.truststore.path: certs/playgroundsystemctl restart elasticsearch && systemctl status elasticsearch$ curl localhost:9200/_cat/nodes?v
{
"error":{
"root_cause":[
{
"type":"security_exception",
"reason":"missing authentication credentials for REST request [/_cat/nodes?v]",
"header":{
"WWW-Authenticate":"Basic realm=\"security\" charset=\"UTF-8\""
}
}
],
"type":"security_exception",
"reason":"missing authentication credentials for REST request [/_cat/nodes?v]",
"header":{
"WWW-Authenticate":"Basic realm=\"security\" charset=\"UTF-8\""
}
},
"status":401
}认证授权
1. master 节点执行# /usr/share/elasticsearch/bin/elasticsearch-setup-passwords interactive
Initiating the setup of passwords for reserved users elastic,apm_system,kibana,logstash_system,beats_system,remote_monitoring_user.
You will be prompted to enter passwords as the process progresses.
Please confirm that you would like to continue [y/N]y
Enter password for [elastic]:
Reenter password for [elastic]:
Enter password for [apm_system]:
Reenter password for [apm_system]:
Enter password for [kibana]:
Reenter password for [kibana]:
Enter password for [logstash_system]:
Reenter password for [logstash_system]:
Enter password for [beats_system]:
Reenter password for [beats_system]:
Enter password for [remote_monitoring_user]:
Reenter password for [remote_monitoring_user]:
Changed password for user [apm_system]
Changed password for user [kibana]
Changed password for user [logstash_system]
Changed password for user [beats_system]
Changed password for user [remote_monitoring_user]
Changed password for user [elastic]| Note | Enter a password and repeat type the pasword in interactive command line, eg, we can set one password like password123 for all users. |
$ curl -u elastic:password123 localhost:9200/_cat/nodes?v
ip            heap.percent ram.percent cpu load_1m load_5m load_15m node.role master name
172.31.20.222           10          96   1    0.01    0.03     0.05 d         -      data-2
172.31.17.25            10          97   1    0.00    0.01     0.05 d         -      data-1
172.31.25.64             9          95   1    0.00    0.03     0.05 im        *      master
Kibana 部署
安装
1. RPM 安装yum install --enablerepo=elasticsearch kibana -ysystemctl enable kibana.service配置
1. 编辑/etc/kibana/kibana.yml,配置server.port: 8080
server.host: "172.31.25.64"
elasticsearch.username: "kibana"
elasticsearch.password: "password123"systemctl start kibana && systemctl status kibanaless /var/log/messages | grep kibana登录访问
浏览器访问 http://13.233.91.208:8080 进入 kibana 登录界面。
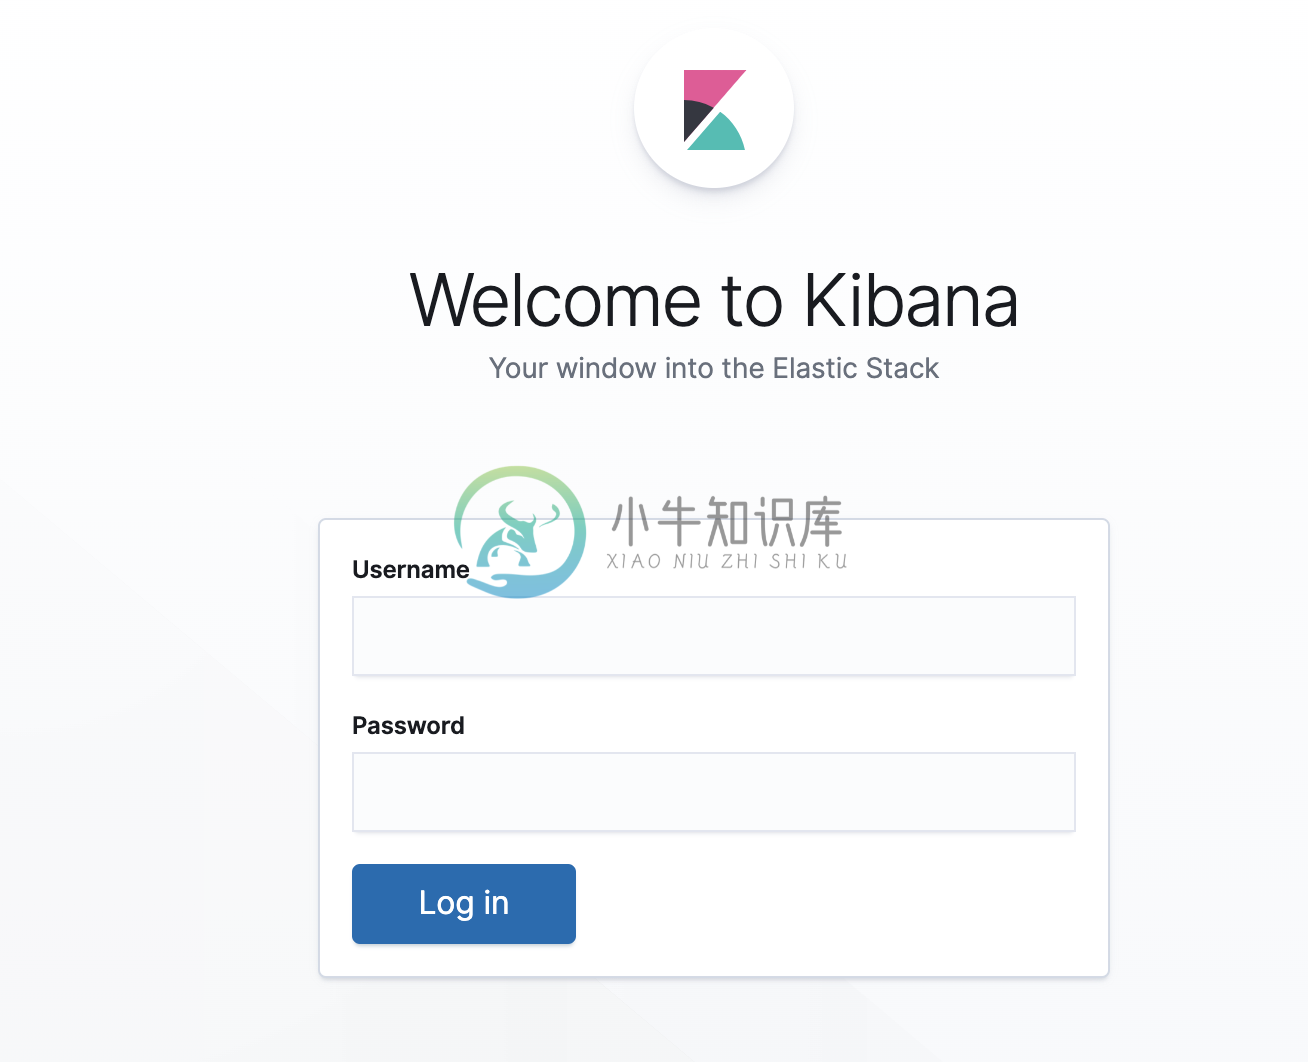
使用 elastic/password123 可以登录 Kibana。
Filebeat 部署
安装
1. 3 个节点执行 yum 安装yum install --enablerepo=elasticsearch filebeat -ysystemctl enable filebeat配置
1. master 上编辑/etc/filebeat/filebeat.yml 添加相应配置信息setup.kibana:
host: "172.31.25.64:8080"
output.elasticsearch:
hosts: ["172.31.25.64:9200"]
username: "elastic"
password: "password123"| Note | the output.elasticsearch.hosts are all ingest nodes. |
# filebeat modules enable system
Enabled system

# filebeat setup
Overwriting ILM policy is disabled. Set `setup.ilm.overwrite:true` for enabling.

Index setup finished.
Loading dashboards (Kibana must be running and reachable)
Loaded dashboards
Setting up ML using setup --machine-learning is going to be removed in 8.0.0. Please use the ML app instead.
See more: https://www.elastic.co/guide/en/elastic-stack-overview/current/xpack-ml.html
Loaded machine learning job configurations
Loaded Ingest pipelinessystemctl start filebeat && systemctl status filebeat$ curl localhost:9200/_cat/indices?v -u elastic:password123
health status index uuid pri rep docs.count docs.deleted store.size pri.store.size
green open filebeat-7.6.1-2020.03.27-000001 glhPB8GAS5C8BNJXIHjFoA 1 1 143731 0 59mb 29.5mb
green open .security-7 D0ym5eFRSl2o3SHkg9RKZA 1 1 42 0 193.6kb 104.7kb
green open .kibana_task_manager_1 KOUch1GmSDSS17styVYlBQ 1 1 2 0 77.7kb 34.2kb
green open ilm-history-1-000001 0Xrr6ptPSHeSjEuOByg1SQ 1 1 6 0 31.3kb 15.6kb
green open .apm-agent-configuration oiiJSPiESISYnUS782R6bw 1 1 0 0 566b 283b
green open .kibana_1 d2fVmqmpThOPIT-619IQfA 1 1 1328 51 1.4mb 738.5kb5. 在 2 个数据节点重复 1 - 3 步骤
6. 重新查看导入的 indices$ curl localhost:9200/_cat/indices?v -u elastic:password123
health status index uuid pri rep docs.count docs.deleted store.size pri.store.size
green open filebeat-7.6.1-2020.03.27-000001 glhPB8GAS5C8BNJXIHjFoA 1 1 317385 0 125.4mb 62.7mb
green open .security-7 D0ym5eFRSl2o3SHkg9RKZA 1 1 42 0 193.6kb 104.7kb
green open .kibana_task_manager_1 KOUch1GmSDSS17styVYlBQ 1 1 2 0 77.7kb 34.2kb
green open ilm-history-1-000001 0Xrr6ptPSHeSjEuOByg1SQ 1 1 18 0 50.8kb 25.4kb
green open .apm-agent-configuration oiiJSPiESISYnUS782R6bw 1 1 0 0 566b 283b
green open .kibana_1 d2fVmqmpThOPIT-619IQfA 1 1 1328 1421 4.1mb 2mbMetricbeat 部署
安装
1. RPM 安装yum install --enablerepo=elasticsearch metricbeat -ysystemctl enable metricbeat配置
1. 编辑/etc/metricbeat/metricbeat.yml 配置setup.kibana:
host: "172.31.25.64:8080"
output.elasticsearch:
hosts: ["172.31.25.64:9200"]
username: "elastic"
password: "password123"# metricbeat setup
Overwriting ILM policy is disabled. Set `setup.ilm.overwrite:true` for enabling.
Index setup finished.
Loading dashboards (Kibana must be running and reachable)
Loaded dashboardssystemctl start metricbeat && systemctl status metricbeat$ curl localhost:9200/_cat/indices?v -u elastic:password123
health status index uuid pri rep docs.count docs.deleted store.size pri.store.size
green open filebeat-7.6.1-2020.03.27-000001 glhPB8GAS5C8BNJXIHjFoA 1 1 412363 0 164.3mb 82.2mb
green open .security-7 D0ym5eFRSl2o3SHkg9RKZA 1 1 42 0 193.6kb 104.7kb
green open metricbeat-7.6.1-2020.03.27-000001 4Vp5jJVLQqKgjtg-pTvq9A 1 1 32 0 237.1kb 118.5kb
green open .kibana_task_manager_1 KOUch1GmSDSS17styVYlBQ 1 1 2 0 77.7kb 34.2kb
green open ilm-history-1-000001 0Xrr6ptPSHeSjEuOByg1SQ 1 1 21 0 66.3kb 33.1kb
green open .apm-agent-configuration oiiJSPiESISYnUS782R6bw 1 1 0 0 566b 283b
green open .kibana_1 d2fVmqmpThOPIT-619IQfA 1 1 2483 80 5.4mb 2.7mb5. 在两个数据节点上重复如上步骤 1 - 3
6. 重新查看导入的 indices*$ curl localhost:9200/_cat/indices?v -u elastic:password123
health status index uuid pri rep docs.count docs.deleted store.size pri.store.size
green open filebeat-7.6.1-2020.03.27-000001 glhPB8GAS5C8BNJXIHjFoA 1 1 413106 0 166.6mb 83mb
green open .security-7 D0ym5eFRSl2o3SHkg9RKZA 1 1 42 0 193.6kb 104.7kb
green open metricbeat-7.6.1-2020.03.27-000001 4Vp5jJVLQqKgjtg-pTvq9A 1 1 629 0 1.2mb 658.5kb
green open .kibana_task_manager_1 KOUch1GmSDSS17styVYlBQ 1 1 2 0 77.7kb 34.2kb
green open .apm-agent-configuration oiiJSPiESISYnUS782R6bw 1 1 0 0 566b 283b
green open ilm-history-1-000001 0Xrr6ptPSHeSjEuOByg1SQ 1 1 21 0 66.3kb 33.1kb
green open .kibana_1 d2fVmqmpThOPIT-619IQfA 1 1 2483 1315 6.7mb 3.3mb数据分析展示
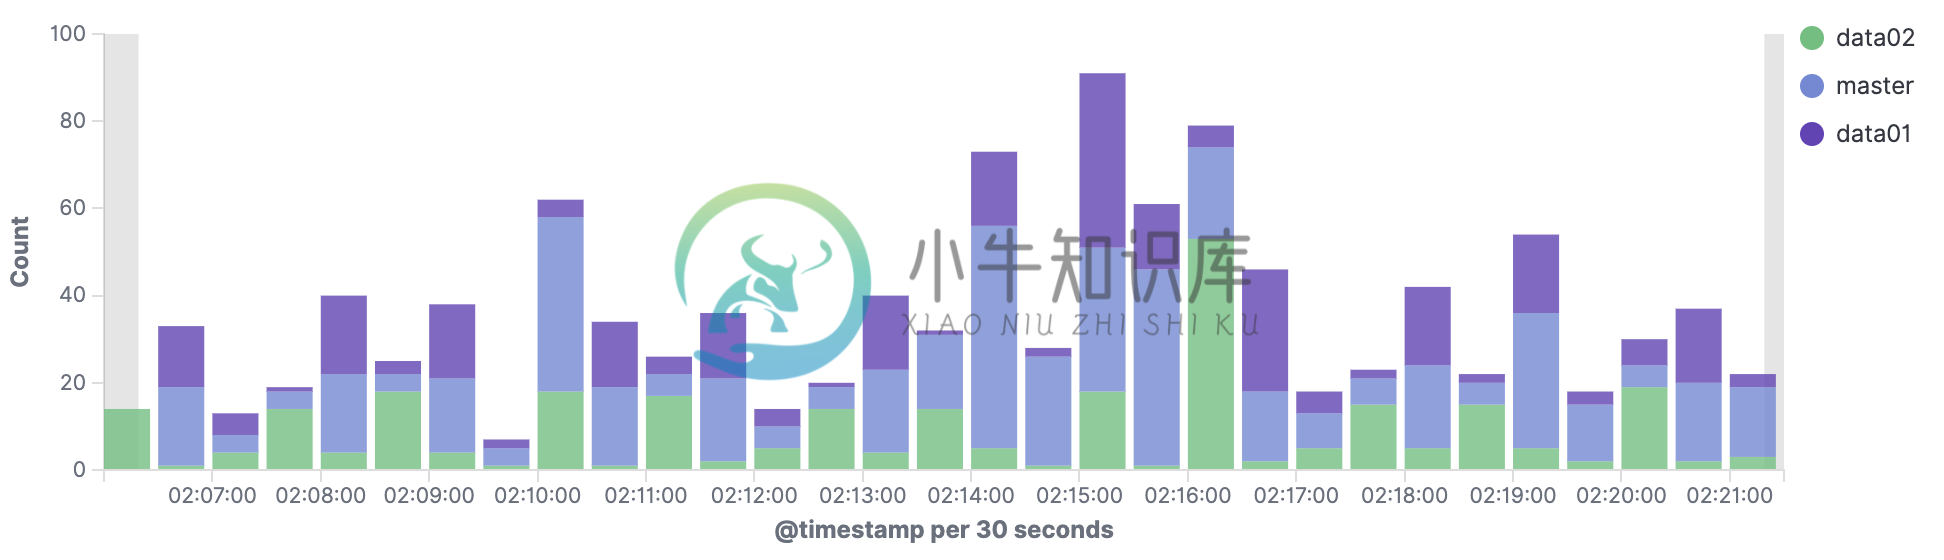
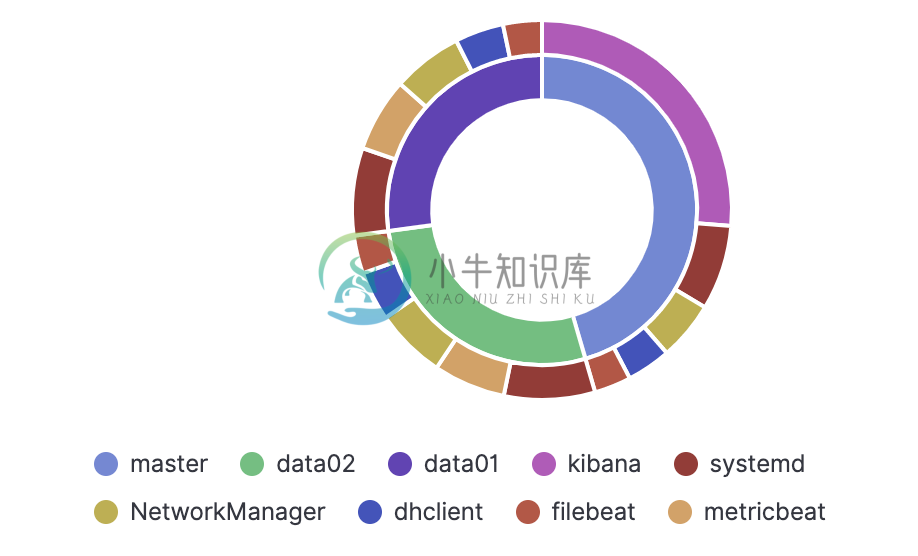
filebeat system
Dashboards → [Filebeat System] Syslog dashboard ECS
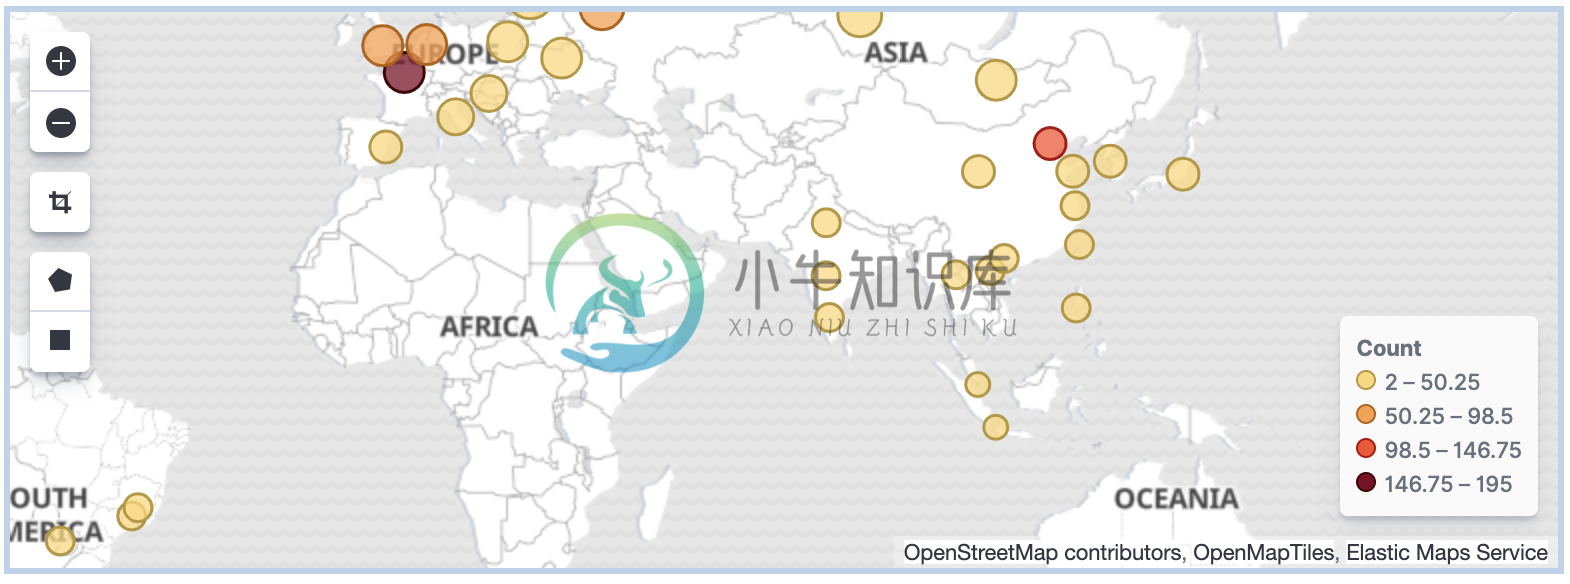
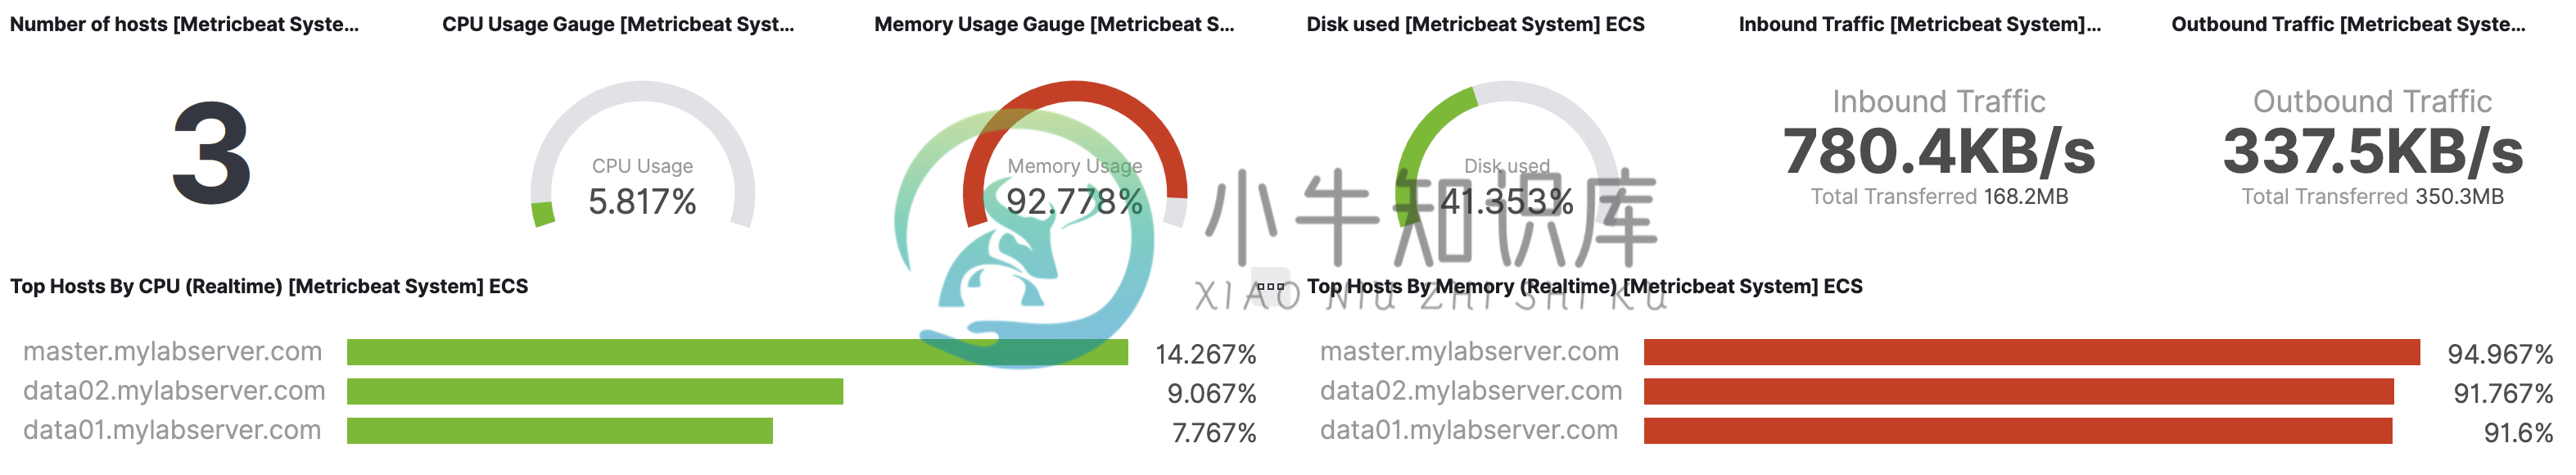
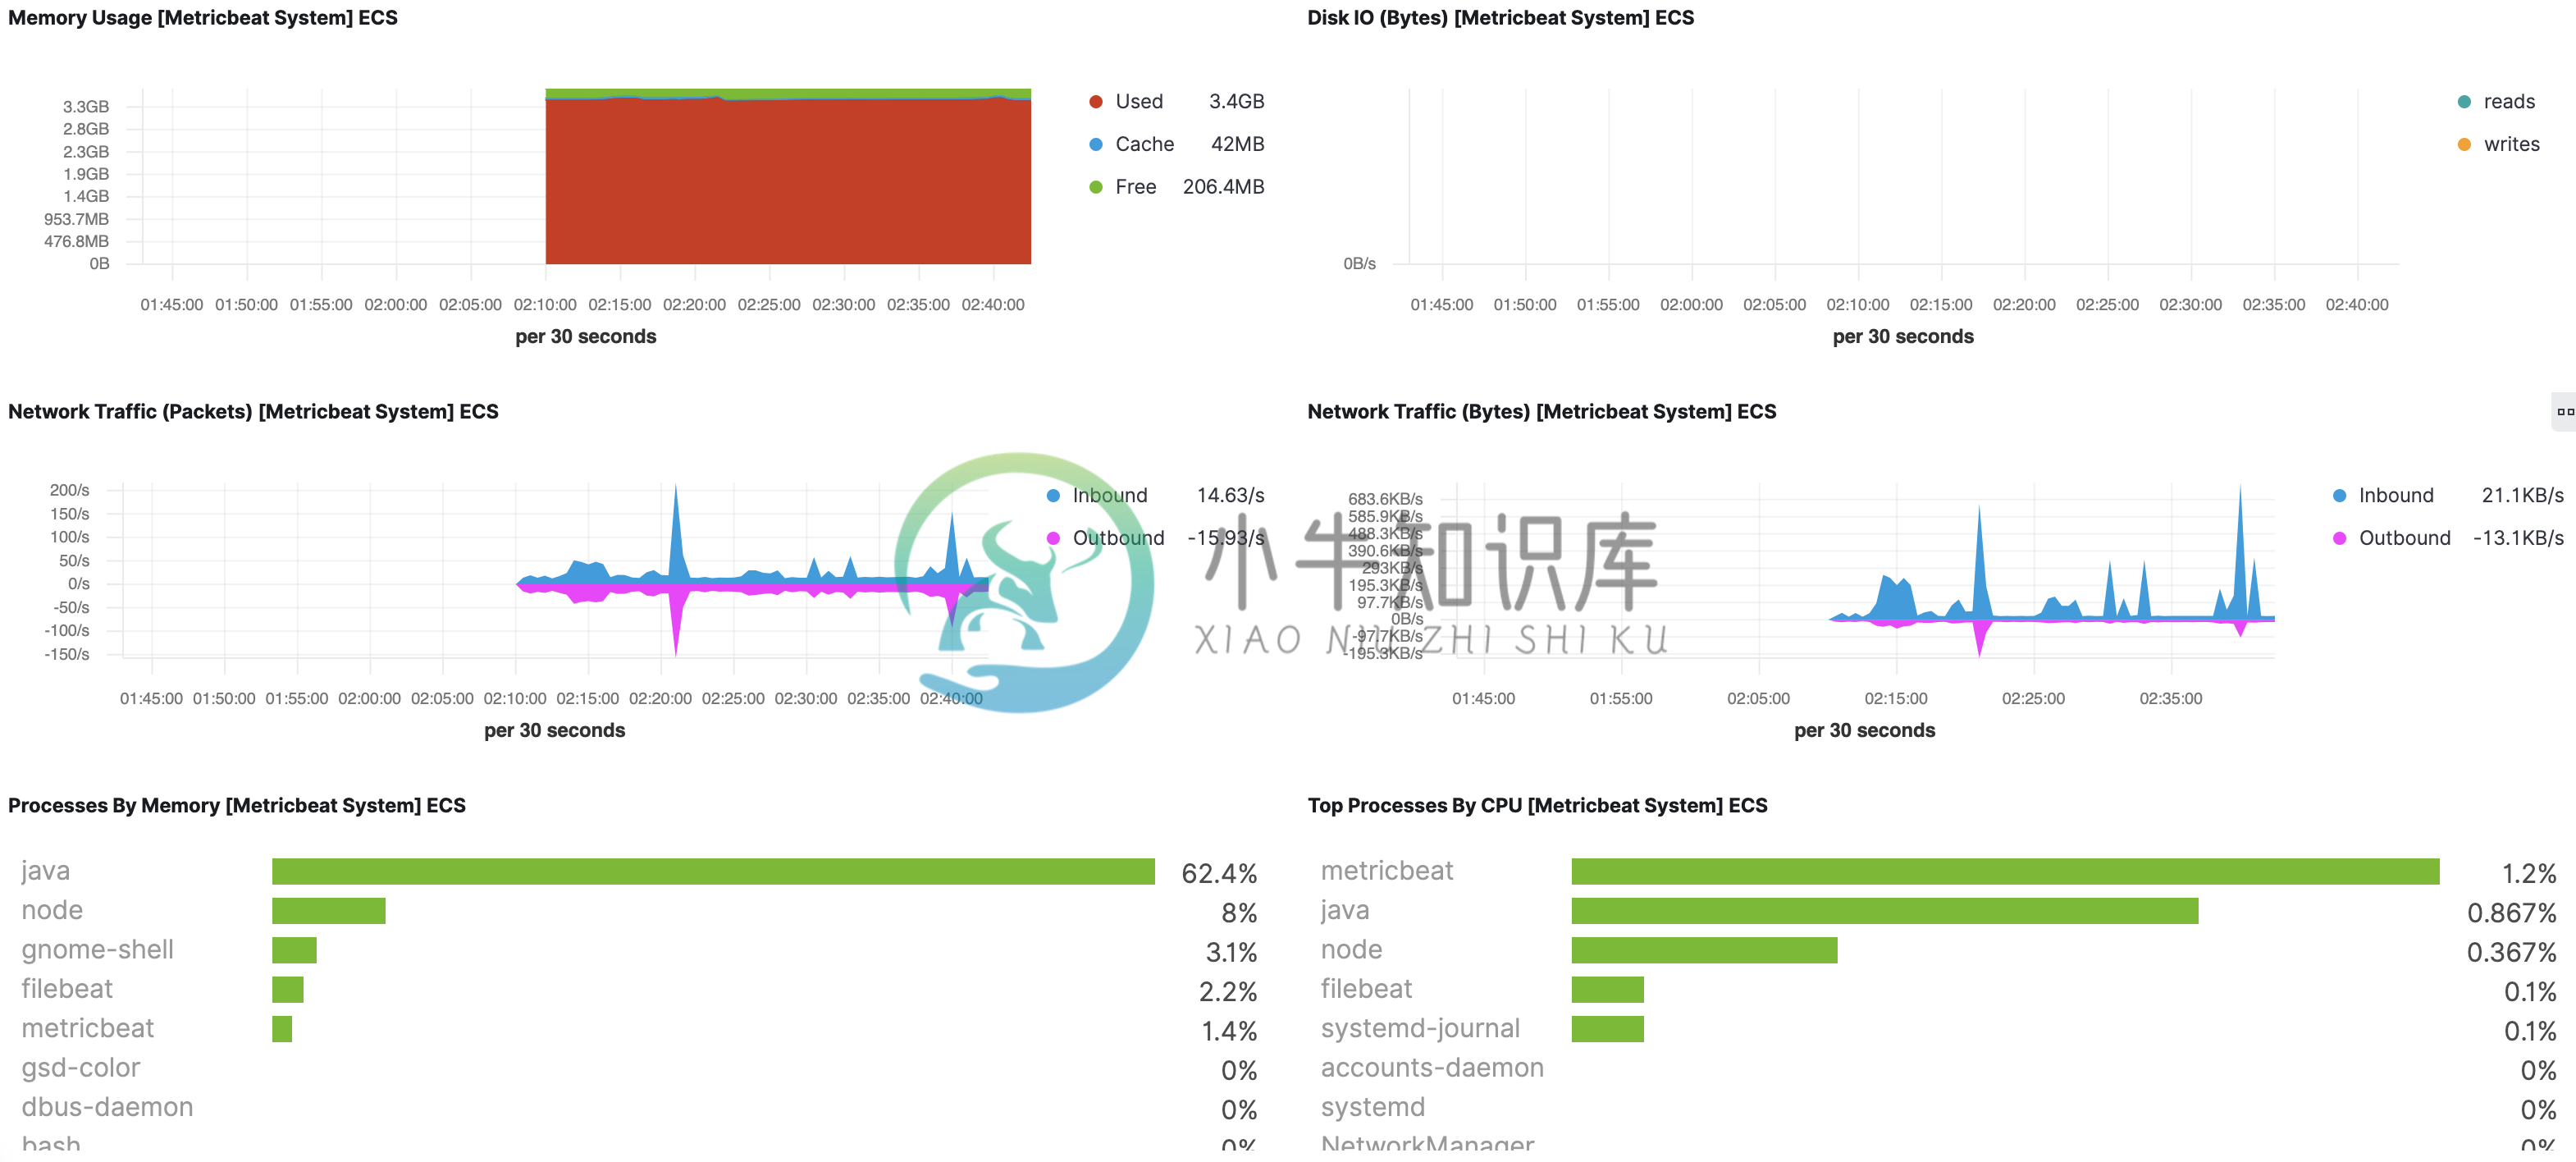
metricbeat system
Dashboards → [Metricbeat System] Overview ECS