GWT Google Charts 组织结构图
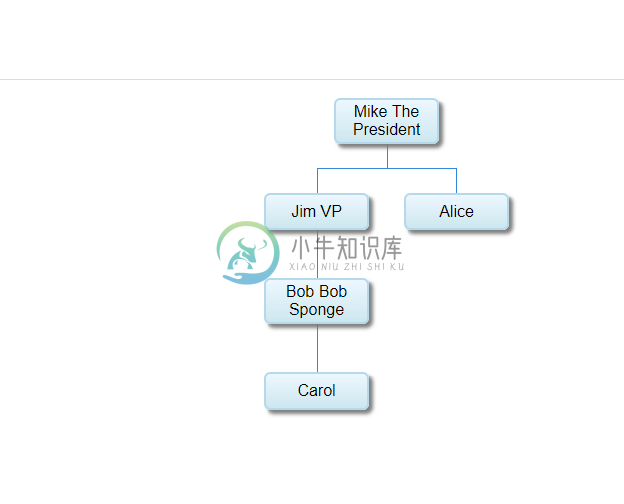
以下是组织结构图的示例。
我们已经在《GWT Google Charts 入门程序》章节中看到了用于绘制图表的基本步骤。现在,让我们看一个组织结构图的例子。
GWT Google Charts 组织结构图 配置
我们使用OrgChart类来显示组织结构图。
// Organization chart
OrgChart chart = new OrgChart();
GWT Google Charts 组织结构图 示例
package cn.xnip.helloWorld.client;

import com.google.gwt.core.client.EntryPoint;
import com.google.gwt.user.client.ui.*;
import com.googlecode.gwt.charts.client.ChartLoader;
import com.googlecode.gwt.charts.client.ChartPackage;
import com.googlecode.gwt.charts.client.ColumnType;
import com.googlecode.gwt.charts.client.DataTable;
import com.googlecode.gwt.charts.client.corechart.*;
import com.googlecode.gwt.charts.client.format.PatternFormat;
import com.googlecode.gwt.charts.client.map.Map;
import com.googlecode.gwt.charts.client.map.MapOptions;
import com.googlecode.gwt.charts.client.options.*;
import com.googlecode.gwt.charts.client.orgchart.OrgChart;
import com.googlecode.gwt.charts.client.orgchart.OrgChartOptions;

public class HelloWorld implements EntryPoint {
    private OrgChart chart;

    private void initialize() {
        ChartLoader chartLoader = new ChartLoader(ChartPackage.ORGCHART);
        chartLoader.loadApi(new Runnable() {
            public void run() {
                // Create and attach the chart
                chart = new OrgChart();
                RootPanel.get().add(chart);
                draw();
            }
        });
    }
    private void draw() {
        // Prepare the data
        DataTable dataTable = DataTable.create();
        dataTable.addColumn(ColumnType.STRING, "Name");
        dataTable.addColumn(ColumnType.STRING, "Manager");
        dataTable.addColumn(ColumnType.STRING, "ToolTip");
        dataTable.addRows(5);

        dataTable.setValue(0, 0, "Mike");
        dataTable.setValue(0, 1, "");
        dataTable.setValue(0, 2, "The President");
        dataTable.setValue(1, 0, "Jim");
        dataTable.setValue(1, 1, "Mike");
        dataTable.setValue(1, 2, "VP");
        dataTable.setValue(2, 0, "Alice");
        dataTable.setValue(2, 1, "Mike");
        dataTable.setValue(2, 2, "");
        dataTable.setValue(3, 0, "Bob");
        dataTable.setValue(3, 1, "Jim");
        dataTable.setValue(3, 2, "Bob Sponge");
        dataTable.setValue(4, 0, "Carol");
        dataTable.setValue(4, 1, "Bob");
        dataTable.setValue(4, 2, "");

        PatternFormat format = PatternFormat.create("{0} {1}");
        format.format(dataTable, 0, 2);

        // Set options
        OrgChartOptions options = OrgChartOptions.create();
        options.setAllowHtml(true);

        // Draw the chart
        chart.draw(dataTable, options);
        chart.setWidth("600px");
        chart.setHeight("400px");
    }
    public void onModuleLoad() {
        initialize();
    }
}
输出结果为: