问题:

javascript - echarts中怎样实现部分线段画虚线?
周云
echarts中怎样实现部分线段画虚线?代码如下,目前可设置整体虚线,但不会设置某条线条为虚线。
let charts = { nodes: [ { name: '1', value: [0, 700] }, { name: '2', value: [200, 700] }, { name: '4', value: [300, 700] }, { name: '5', value: [400, 700] }, { name: '9', value: [600, 700] }, { name: '15', value: [900, 700] }, { name: '17', value: [960, 700] }, ], linesData: [ { name: '降水1(10天)', coords: [[20, 700], [190, 700]], type: "dotted" }, { name: '开挖1\n(5天)', coords: [[220, 700], [290, 700]] }, { name: '砂石垫层1\n(5天)', coords: [[320, 700], [390, 700]] }, { name: '混凝土基础1(10天)', coords: [[420, 700], [590, 700]] }, { name: '混钢筋混凝土安装1(15天)', coords: [[620, 700], [890, 700]] }, { name: '土方回填1\n(3天)', coords: [[920, 700], [950, 700]] }, ] } let option = { xAxis: { min: 0, max: 2200, show: false, type: "value", }, yAxis: { min: 0, max: 1000, show: false, type: "value", }, grid: { left: 50, right: 0, bottom: 0, top: 0 }, tooltip: { show: false, axisPointer: { type: "shadow", }, borderColor: "white", backgroundColor: "white", borderWidth: 1, padding: 5, textStyle: { fontSize: 14, color: '#333', }, }, series: [ { type: "graph", coordinateSystem: "cartesian2d", symbol: "circle", symbolSize: [40, 40], // edgeSymbol: ['', 'arrow'], // edgeSymbolSize: [1, 10], lineStyle: { normal: { width: 0, color: 'green', } }, itemStyle: { color: "rgb(194, 194, 194)", }, symbolOffset: [10, 0], force: { edgeLength: 100, repulsion: 150 }, label: { show: true, color: '#333', }, data: charts.nodes }, { type: "lines", polyline: false, coordinateSystem: "cartesian2d", symbol: ['', 'arrow'], symbolSize: 10, label: { show: true, position: "middle", fontSize: 16, color: '#333', formatter: function (args) { }, }, lineStyle: { color: '#65B7E3', width: 2, }, data: charts.linesData, }, ], };
{ name: '混钢筋混凝土安装1(15天)', coords: [[620, 700], [890, 700]] },比如在上面这行代码中是否可设置参数实现虚线呢?
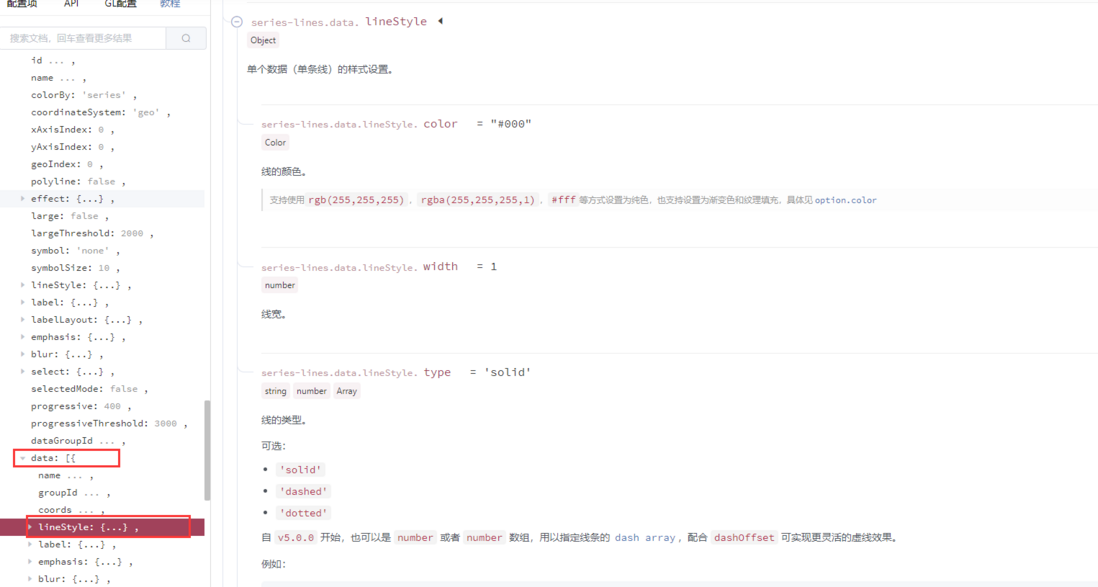
lineStyle中设置type: "dashed"可实现虚线,
共有1个答案
晏正豪
可以在data中对应的元素中单独设置
https://echarts.apache.org/zh/option.html#series-lines.data.l...
类似资料:
-
如图所示,我想改这里的字体大小,字体粗细,该怎么做 文档地址:https://echarts.apache.org/examples/zh/editor.html?c=pie-simple 先谢谢各位大哥大姐的解答!
-
请问图片的这条圆弧线 用css 怎么去写。 用border-top-left-radius 感觉实现不了。
-
如下图所示,每列只能点一个黑点,点击之后将被选中的点连接成折线。 看来echarts没有类似的,没有思路实现。
-
想问下这种样式怎么实现
-
用Echarts GL怎么实现这种效果 有没有类似例子的配置代码参考
-
前端大佬们求助,这种图怎么弄出来啊 求教求教 ![Echarts 3D饼图] 在经历各种 百度 Google Ecahrts社区 及 各大博客 都没搞出来

