前端 - 我需要绘制一个能够根据不同柱子的数值配置不同颜色的柱状图,请问应该如何实现?
我需要绘制一个柱状图,每个柱子能够根据不同的数据得到不同的颜色。请问应该如何实现?
共有2个答案
用echarts就可以实现,举个简单的例子
// 获取容器元素const container = document.getElementById("chartContainer");// 初始化图表const chart = echarts.init(container);// 定义柱子的数值和颜色const values = [10, 20, 30, 40, 50]; // 柱子的数值const colors = ["red", "green", "blue", "yellow", "orange"]; // 对应柱子的颜色// 配置图表const options = { xAxis: { type: "category", data: ["A", "B", "C", "D", "E"], // 柱子的标签 }, yAxis: { type: "value", }, series: [ { type: "bar", data: values, itemStyle: { color: (params) => colors[params.dataIndex], // 使用颜色数组设置每个柱子的颜色 }, }, ],};// 渲染图表chart.setOption(options);可以使用 VChart 中配置柱子样式的回调来根据数据内容自定义颜色。
代码示例:
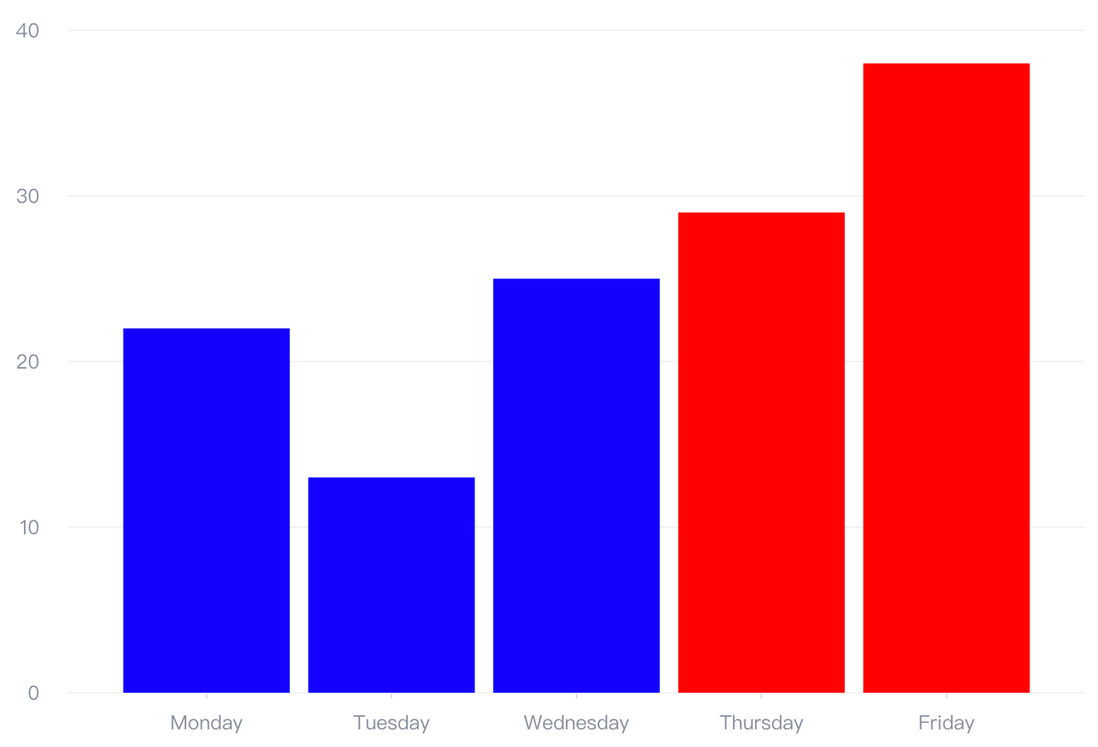
const spec = { type: 'bar', data: [ { id: 'barData', values: [ { month: 'Monday', sales: 22 }, { month: 'Tuesday', sales: 13 }, { month: 'Wednesday', sales: 25 }, { month: 'Thursday', sales: 29 }, { month: 'Friday', sales: 38 } ] } ], xField: 'month', yField: 'sales', bar: { style: { fill: (datum) => { return datum.sales > 25 ? 'red' : 'blue'; } } }};const vchart = new VChart(spec, { dom: CONTAINER_ID });vchart.renderAsync();// Just for the convenience of console debugging, DO NOT COPY!window['vchart'] = vchart;可以把代码放在 vchart 官网任何一个 demo 的 playground 里试一下,非常方便。比如下面地址就可以:https://www.visactor.io/vchart/demo/bar-chart/basic-column
图表效果:
相关资源可参考:
github:https://github.com/VisActor/VChart
barChart style spec: https://www.visactor.io/vchart/option/barChart#bar.style.fill
-
因为数据数量不确定,数据太少时柱状图柱子太宽不符合设计稿,怎么配置可以将柱子的宽度变窄?同时当数据很多的时候,柱子可以保持原本的宽度。
-
我想在一个柱状图里头监听每个柱子的点击事件,如果柱子被点击了就画成不同的颜色,大概像这样: 但是点击事件触发之后我不希望重新渲染整个图表,最好能够在当前图表的基础上有一个平滑过度的效果,这个应该怎么实现呢?
-
我有一个双轴图,由折线图和柱状图组成,一个折线图中可能有多条线,一个柱状图中可能有多个柱。 在由折线图和柱状图组成的双轴图中,如何自由的定义每一个柱和折线的颜色等信息?
-
我正在尝试在 matplotlib 中绘制具有多个数据序列的直方图。 我有不相等间隔的箱子,但是我想要每个箱子得到相同的宽度。所以我这样使用属性< code>width: 结果是: 我怎样才能去掉两个系列的两个对应箱子之间的边距?一、 e.如何为每个箱子分组不同系列的钢筋? 谢谢
-
本文向大家介绍Python画图实现同一结点多个柱状图的示例,包括了Python画图实现同一结点多个柱状图的示例的使用技巧和注意事项,需要的朋友参考一下 如下所示: 以上这篇Python画图实现同一结点多个柱状图的示例就是小编分享给大家的全部内容了,希望能给大家一个参考,也希望大家多多支持呐喊教程。

