
DBS可以去除绘图中的噪声

使用DBSCAN,
(DBSCAN(eps=epsilon, min_samples=10, algorithm='ball_tree', metric='haversine')
我已经聚集了一个纬度和经度对列表,然后使用matplotlib绘制了该列表。打印时,它包括“噪波”坐标,即未指定给已创建的270个簇之一的点。我想从绘图中删除噪波,只绘制满足指定要求的集群,但我不确定如何做到这一点。如何排除噪波(同样,那些未指定给簇的点)?
下面是我用来聚类和绘图的代码:
df = pd.read_csv('xxx.csv')

# define the number of kilometers in one radiation
# which will be used to convert esp from km to radiation
kms_per_rad = 6371.0088

# define a function to calculate the geographic coordinate
# centroid of a cluster of geographic points
# it will be used later to calculate the centroids of DBSCAN cluster
# because Scikit-learn DBSCAN cluster class does not come with centroid attribute.
def get_centroid(cluster):
"""calculate the centroid of a cluster of geographic coordinate points
Args:
  cluster coordinates, nx2 array-like (array, list of lists, etc)
  n is the number of points(latitude, longitude)in the cluster.
Return:
  geometry centroid of the cluster

"""
cluster_ary = np.asarray(cluster)
centroid = cluster_ary.mean(axis=0)
return centroid

# convert eps to radians for use by haversine
epsilon = 0.1/kms_per_rad #1.5=1.5km  1=1km  0.5=500m 0.25=250m   0.1=100m

# Extract intersection coordinates (latitude, longitude)
tweet_coords = df.as_matrix(columns=['latitude','longitude'])

start_time = time.time()
dbsc = (DBSCAN(eps=epsilon, min_samples=10, algorithm='ball_tree', metric='haversine')
    .fit(np.radians(tweet_coords)))

tweet_cluster_labels = dbsc.labels_

# get the number of clusters
num_clusters = len(set(dbsc.labels_))

# print the outcome
message = 'Clustered {:,} points down to {:,} clusters, for {:.1f}% compression in {:,.2f} seconds'
print(message.format(len(df), num_clusters, 100*(1 - float(num_clusters) / len(df)), time.time()-start_time))
print('Silhouette coefficient:     {:0.03f}'.format(metrics.silhouette_score(tweet_coords, tweet_cluster_labels)))

# Turn the clusters into a pandas series,where each element is a cluster of points
dbsc_clusters = pd.Series([tweet_coords[tweet_cluster_labels==n] for n in  range(num_clusters)])

# get centroid of each cluster
cluster_centroids = dbsc_clusters.map(get_centroid)
# unzip the list of centroid points (lat, lon) tuples into separate lat and lon lists
cent_lats, cent_lons = zip(*cluster_centroids)
# from these lats/lons create a new df of one representative point for eac   cluster
centroids_df = pd.DataFrame({'longitude':cent_lons, 'latitude':cent_lats})
#print centroids_df

# Plot the clusters and cluster centroids
fig, ax = plt.subplots(figsize=[20, 12])
tweet_scatter = ax.scatter(df['longitude'], df['latitude'],   c=tweet_cluster_labels, cmap = cm.hot, edgecolor='None', alpha=0.25, s=50)
centroid_scatter = ax.scatter(centroids_df['longitude'], centroids_df['latitude'], marker='x', linewidths=2, c='k', s=50)
ax.set_title('Tweet Clusters & Cluser Centroids', fontsize = 30)
ax.set_xlabel('Longitude', fontsize=24)
ax.set_ylabel('Latitude', fontsize = 24)
ax.legend([tweet_scatter, centroid_scatter], ['Tweets', 'Tweets Cluster Centroids'], loc='upper right', fontsize = 20)
plt.show()
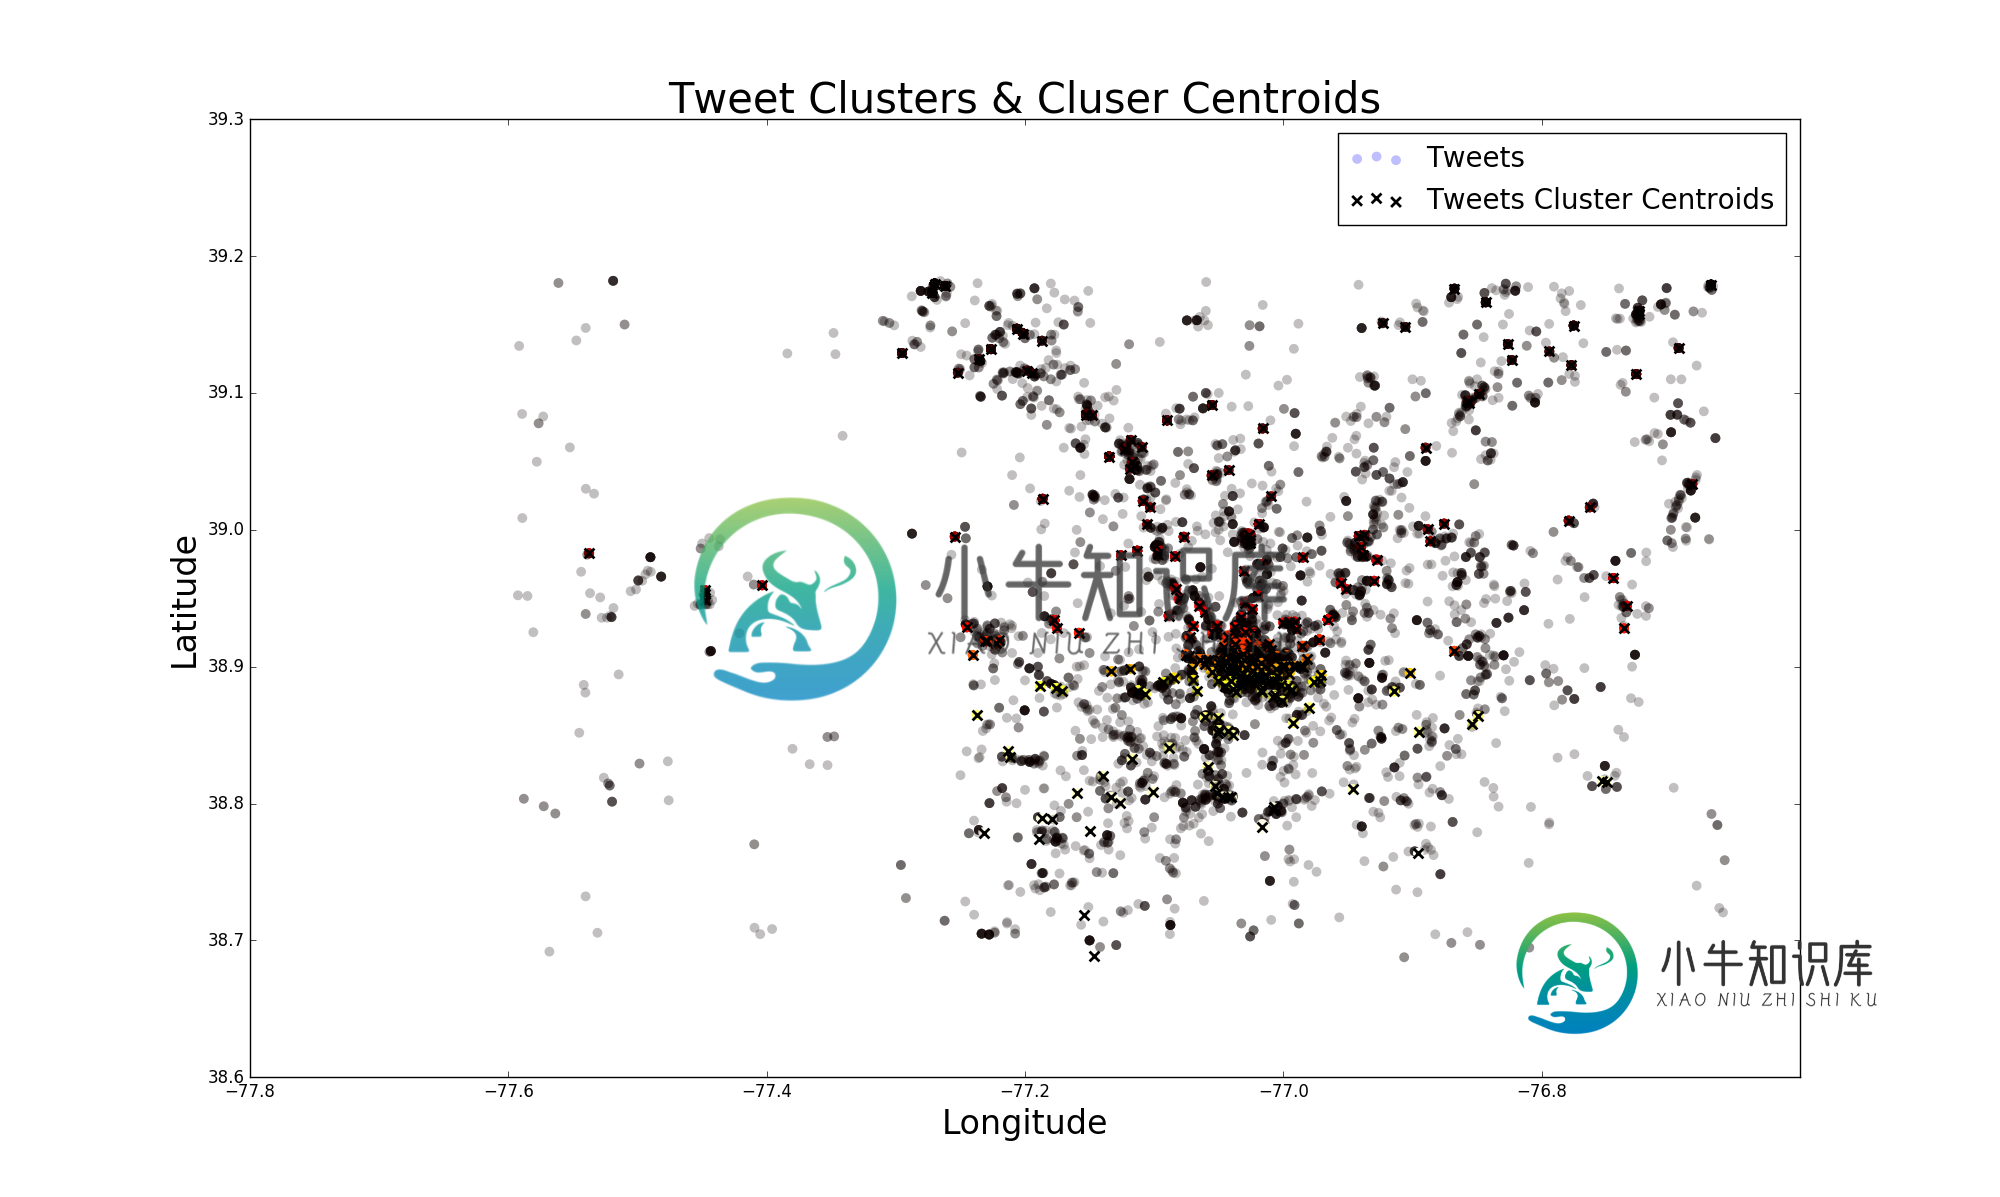
黑点是噪声,那些未添加到DBSCAN输入定义的簇中的噪声,而有色点是簇。我的目标是将集群可视化。
共有1个答案

将标签存储在原始DataFrame中的附加列中
df['tweet_cluster_labels'] = tweet_cluster_labels
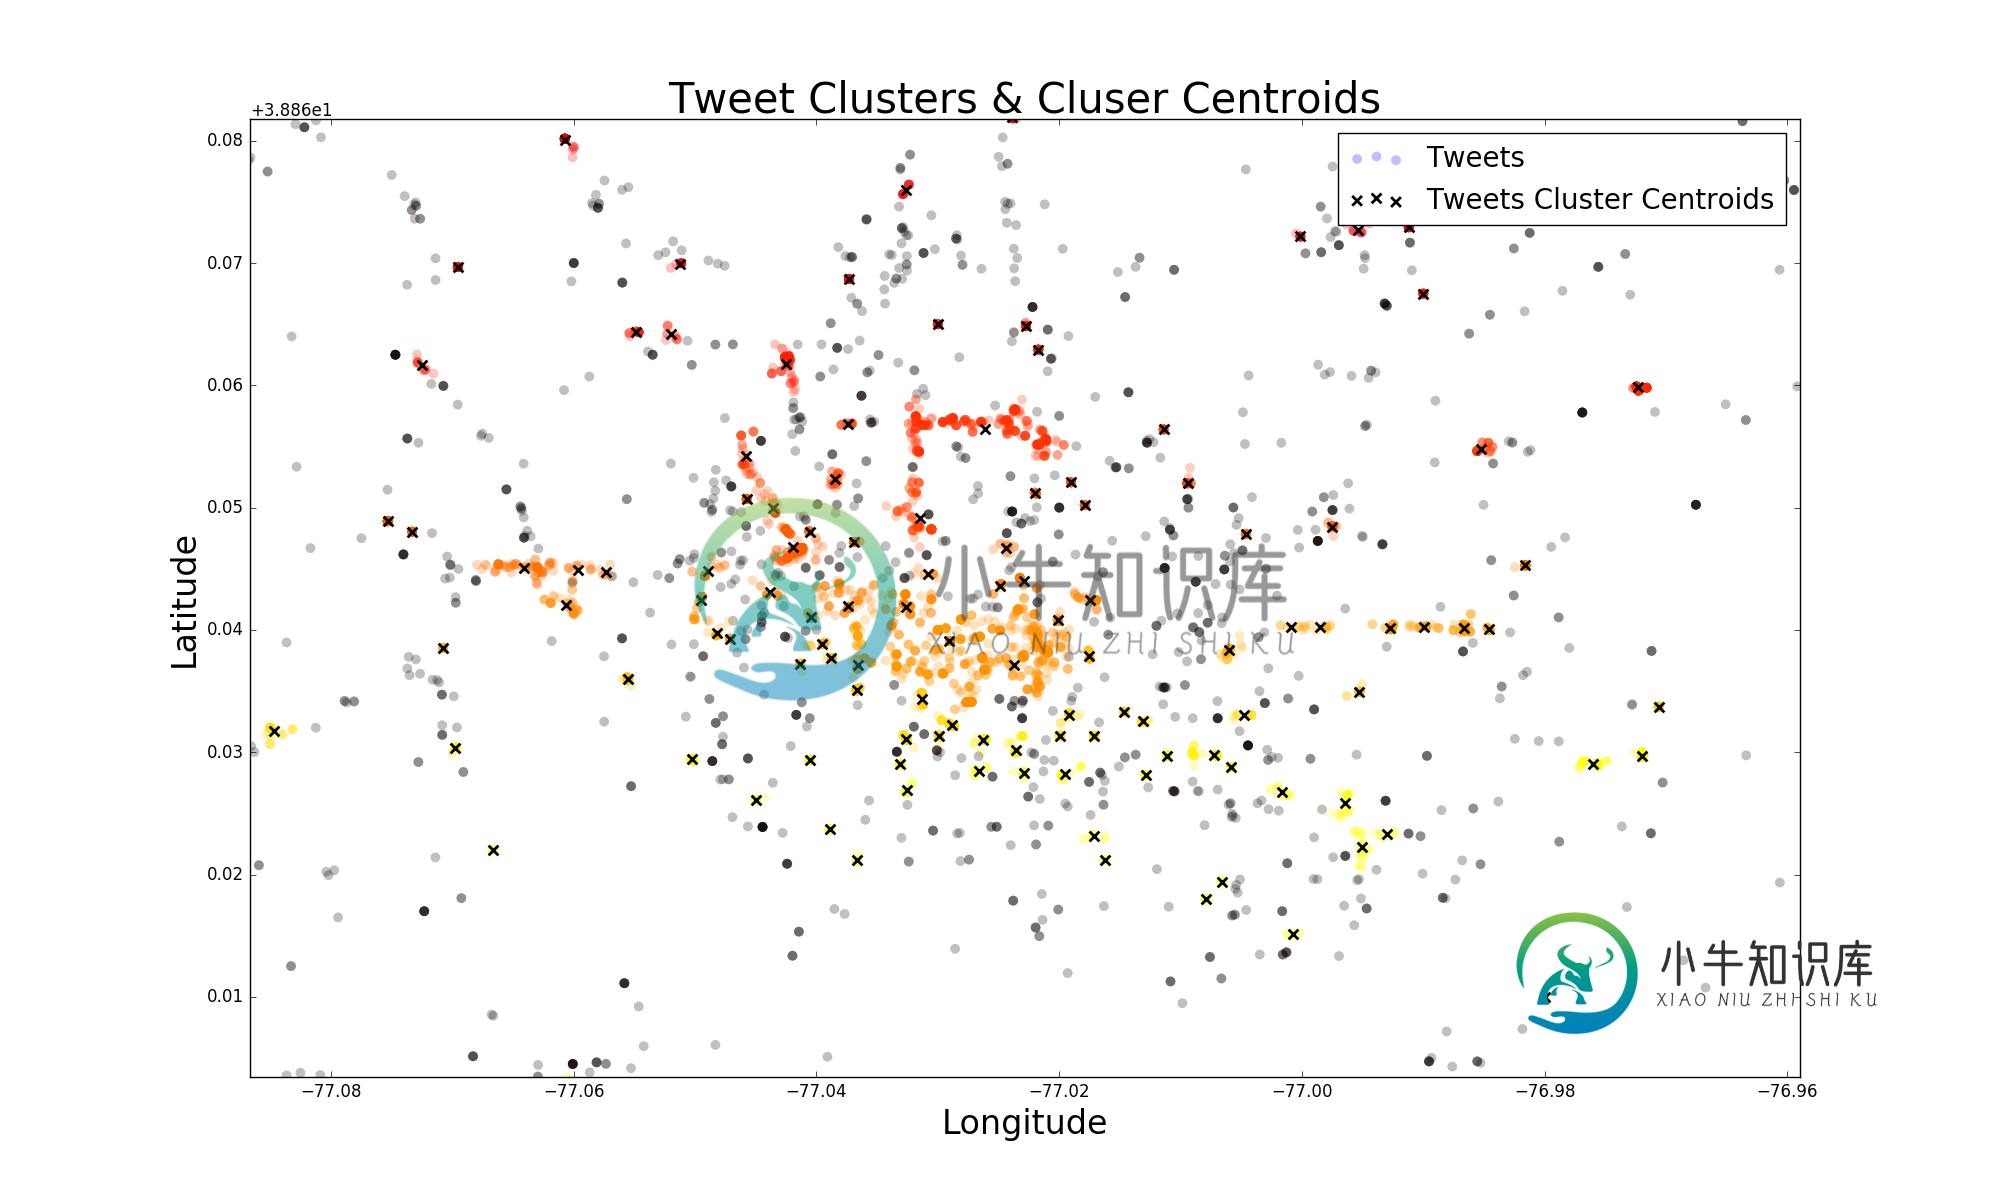
对数据帧进行过滤,使其仅包含非噪声点(噪声样本的标签为-1)
df_filtered = df[df.tweet_cluster_labels>-1]
然后画出这些点
tweet_scatter = ax.scatter(df_filtered['longitude'],
                df_filtered['latitude'],
                c=df_filtered.tweet_cluster_labels,
                cmap=cm.hot, edgecolor='None', alpha=0.25, s=50)
-
目标 在这一章当中, 您将了解非局部均值消噪算法,以消除图像中的噪声。 你会看到几个不同的函数,如 cv2.fastNlMeansDenoising(),cv2.fastNlMeansDenoisingColored() 等 理论基础 在前面的章节中,我们看到了许多像高斯模糊,中值模糊等图像平滑技术,它们在一定程度上消除了少量的噪声。在这些技术中,我们在像素周围采取了一个小的邻域,并进行了一些像高
-
图像去噪 作者|OpenCV-Python Tutorials 编译|Vincent 来源|OpenCV-Python Tutorials 目标 在本章中, 你将学习用于去除图像中噪声的非局部均值去噪算法。 你将看到不同的函数,例如cv.fastNlMeansDenoising(),cv.fastNlMeansDenoisingColored()等。 理论 在前面的章节中,我们已经看到了许多图像平
-
我试图写一个程序,将消除噪声从一个高斯滤波器的图像。我试图编写以下代码: 但我并没有消除噪声,反而使图像变暗了。我做错了什么? 高斯噪声是具有等于正态分布概率密度的概率密度的统计噪声,也称为高斯。换句话说,这种噪声的值具有高斯分布。以卡尔·高斯的名字命名。 一个特例是高斯白噪声,那么在任何给定时间的值都是独立的且均匀分布的随机变量(这意味着它们在一起不相关)。在对通信信道进行测试建模时,将高斯噪声
-
问题内容: 是否可以在CSS中为渐变添加噪音? 这是我的径向渐变代码: 我还要添加什么以使其上具有噪声,赋予其纹理? 问题答案: CSS目前没有办法在背景中添加“噪音”。 一种替代解决方案是在图形编辑器中创建透明噪波png。然后将该图形作为背景应用到。然后,您需要将其放置在的整个区域上,然后应该会出现带有噪声的渐变外观。
-
如何删除悬空的Docker图像?我试过了 尝试连接到unix上的Docker后台程序套接字时获取的权限被拒绝:///var/run/Docker.sock:获取http://%2fvar%2frun%2fdocker.sock/v1.35/images/json?filters=%7b%22dangling%22%3a%7b%22true%22%3atrue%7d%7d:拨号unix/var/ru
-
我想以编程方式旋转绘图。 我该怎么做? 这是我的复试 不大于0.1,我不确定提取值是多少。
-
问题内容: 我的Java堆栈跟踪中有很多我不关心的条目,它们显示了通过代理和Spring反射方法以及类似内容进行的方法调用。很难从我的代码中挑选出堆栈跟踪的一部分。Ruby on Rails包含一个“堆栈跟踪清理器”,您可以在其中指定要从打印的堆栈跟踪中忽略的堆栈跟踪模式列表-对于Java而言,这样做的最佳方法是什么? 最好在任何地方都可以使用它,包括在Eclipse jUnit运行程序中。 问题
-
问题内容: 我正在开发的Java Swing GUI需要根据程序中生成的x和y坐标绘制2D图形。 为此有一个Swing组件吗? 还是有其他目的的开源软件包? 问题答案: 您应该查看具有Swing支持的JFreeChart。以下是一些示例: http://www.jfree.org/jfreechart/samples.html