
图表2 -在同一图表上具有相同y轴的堆积条形图和未堆积折线图

我已经开始使用图表v2的最新测试版。js,因为我需要在同一个图表上绘制一个包含堆叠条形图和非堆叠折线图的图表。以下是我需要的示例:
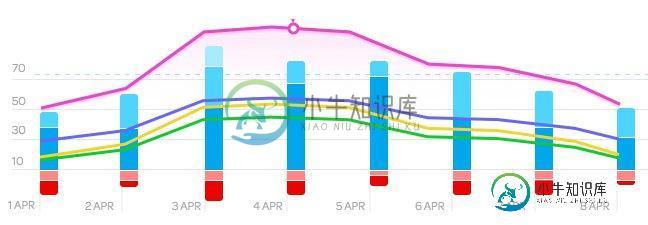
在此图表中,线条没有堆叠在一起,并且都显示了它们的自然值,但是条形图是堆叠在一起的,并且显示了这些值的组合总和(包括一些负值)。
我已经成功地将两个图表绘制在一起,但到目前为止,我只成功地将这两个图表堆叠起来,或者我不得不使用两个单独的y轴,最终得到两个刻度。这里有一个单独y轴的例子:
yAxes: [{
    stacked: false,
    ticks: {
      beginAtZero: true
    }
  }, {
    id: "bar-y-axis",
    stacked: true,
    ticks: {
      beginAtZero: true
    },
    type: 'linear'
  }]
如果我删除第一个y轴,那么我最终会得到一个单一的刻度,唯一的问题是折线图现在也是堆叠的。
有没有办法像我需要的那样使用图表.js绘制图表?
共有3个答案

您可以在条形数据集上设置堆叠属性,这样线就不会堆叠。试着这样做:
 data: {
      datasets: [{
        label: 'Line 1',
        data: [],
        backgroundColor: '#3788d8cc',
        borderColor: '#3788d8cc',
        fill: false
      }, {
        label: 'Stacked bar 1',
        data: [],
        backgroundColor: '#e51c23',
        borderColor: '#e51c23',
        type: 'bar',
        stack: 'bar-stacked'
      }, {
        label: 'Line 2',
        data: [],
        backgroundColor: '#ff9800',
        borderColor: '#ff9800',
        fill: false
      },
      {
        label: 'Stacked bar 2',
        data: [],
        type: 'bar',
        backgroundColor: '#3f51b5',
        borderColor: '#3f51b5',
        stack: 'bar-stacked'
      }],
      labels: [],
    },
    options: {
      maintainAspectRatio: false,
      legend: {
        display: true
      },
      scales: {
        xAxes: [{
          display: true
        }],
        yAxes: [{
          display: true
        }]
      }
    }

另一个答案是——你可以为你想要累积的数据设置一个“堆栈”标识符(例如,只是条形),并关闭线形图上的“填充”,只绘制一条线而不是山脉
Chart.js移除堆叠

您可以通过为每个数据集设置不同的yAxisID(例如yAxisID:"bar-stack"),然后添加第二个options.scales.yAxes对象来获得此功能。因此,您将此作为数据集:
{
  label: 'Promoters',
  backgroundColor: "#aad700",
  yAxisID: "bar-stacked",
  data: [
    50, 44, 52, 62, 48, 58, 59, 50, 51, 52, 53, 54
  ]
}
然后您将添加一个额外的yAx(第一个将是您的行数据集[noyAxisId在下面的示例中]的集合,第二个将是您想要堆叠的所有条):
yAxes: [{
  stacked: false,
  ticks: {
    beginAtZero: true,
    min: 0,
    max: 100
  }
}, {
  id: "bar-stacked",
  stacked: true,
  display: false, //optional if both yAxes use the same scale
  ticks: {
    beginAtZero: true,
    min: 0,
    max: 100
  },
  type: 'linear'
}]
完整示例如下:
<!doctype html>
<html>

<head>
  <title>Stacked Bar Chart</title>
  <script src="https://cdnjs.cloudflare.com/ajax/libs/jquery/2.1.3/jquery.min.js"></script>
  <script src="https://cdnjs.cloudflare.com/ajax/libs/Chart.js/2.1.3/Chart.bundle.js"></script>
  <style>
    canvas {
      -moz-user-select: none;
      -webkit-user-select: none;
      -ms-user-select: none;
    }
  </style>
</head>

<body>
  <div style="width: 100%">
    <canvas id="canvas"></canvas>
  </div>
  <script>
    var barChartData = {
      labels: ["January", "February", "March", "April", "May", "June", "July", "August", "September", "October", "November", "December"],
      datasets: [{
        data: [
          50, 30, 60, 70, 80, 90, 95, 70, 90, 20, 60, 95
        ],
        type: 'line',
        label: 'This Year',
        fill: false,
        backgroundColor: "#fff",
        borderColor: "#70cbf4",
        borderCapStyle: 'butt',
        borderDash: [],
        borderDashOffset: 0.0,
        borderJoinStyle: 'miter',
        lineTension: 0.3,
        pointBackgroundColor: "#fff",
        pointBorderColor: "#70cbf4",
        pointBorderWidth: 1,
        pointHoverRadius: 5,
        pointHoverBackgroundColor: "#70cbf4",
        pointHoverBorderColor: "#70cbf4",
        pointHoverBorderWidth: 2,
        pointRadius: 4,
        pointHitRadius: 10
      }, {
        data: [
          25, 40, 30, 70, 60, 50, 40, 70, 40, 80, 30, 90
        ],
        type: 'line',
        label: 'Last Year',
        fill: false,
        backgroundColor: "#fff",
        borderColor: "#737373",
        borderCapStyle: 'butt',
        borderDash: [10, 10],
        borderDashOffset: 0.0,
        borderJoinStyle: 'miter',
        lineTension: .3,
        pointBackgroundColor: "#fff",
        pointBorderColor: "#737373",
        pointBorderWidth: 1,
        pointHoverRadius: 5,
        pointHoverBackgroundColor: "#737373",
        pointHoverBorderColor: "#737373",
        pointHoverBorderWidth: 2,
        pointRadius: 4,
        pointHitRadius: 10
      }, {
        label: 'Promoters',
        backgroundColor: "#aad700",
        yAxisID: "bar-y-axis",
        data: [
          50, 44, 52, 62, 48, 58, 59, 50, 51, 52, 53, 54
        ]
      }, {
        label: 'Passives',
        backgroundColor: "#ffe100",
        yAxisID: "bar-y-axis",
        data: [
          20, 21, 24, 25, 26, 17, 28, 19, 20, 11, 22, 33
        ]
      }, {
        label: 'Detractors',
        backgroundColor: "#ef0000",
        yAxisID: "bar-y-axis",
        data: [
          30, 35, 24, 13, 26, 25, 13, 31, 29, 37, 25, 13
        ]
      }]
    };

    window.onload = function() {
      var ctx = document.getElementById("canvas").getContext("2d");
      window.myBar = new Chart(ctx, {
        type: 'bar',
        data: barChartData,
        options: {
          title: {
            display: true,
            text: "Chart.js Bar Chart - Stacked"
          },
          tooltips: {
            mode: 'label'
          },
          responsive: true,
          scales: {
            xAxes: [{
              stacked: true,
            }],
            yAxes: [{
              stacked: false,
              ticks: {
                beginAtZero: true,
                min: 0,
                max: 100
              }
            }, {
              id: "bar-y-axis",
              stacked: true,
              display: false, //optional
              ticks: {
                beginAtZero: true,
                min: 0,
                max: 100
              },
              type: 'linear'
            }]
          }
        }
      });
    };
  </script>
</body>

</html>-
StackedBarChart是BarChart的变体,它绘制了指示类别数据值的条形图。 条形可以是垂直的或水平的,这取决于哪个轴是类别轴。 每个系列的栏位于上一系列的顶部。 以下是堆积条形图,描绘了人口增长。 在JavaFX中,堆积条形图由名为StackedBarChart的类StackedBarChart 。 该类属于包javafx.scene.chart 。 通过实例化此类,您可以在Java
-
我正在创建一个JFreeChart堆叠区域图表。 我希望我的y轴标签的宽度是固定的,我不想移动图表随着宽度的增加。见说明问题的图像。 我也面临着JFreeChart论坛上发布的类似问题。根据论坛,它是固定的,但它还没有发布。有没有人知道它的解决办法。我们迫不及待地等待下一个版本,有谁知道我们可以应用的黑客吗? 希望能找到解决办法。
-
问题内容: 我正在尝试使用创建水平堆叠的条形图,但是我看不到如何使条形实际堆叠,而不是全部从y轴开始。 这是我的测试代码。 看到tcaswell的评论后,编辑使用kwarg。 这似乎是正确的方法,但是如果没有特定条形的数据,则尝试失败,因为它正尝试添加到随后返回的值。 问题答案: 由于您使用的是熊猫,因此值得一提的是,您可以在本地进行堆积条形图: 请参阅 文档的可视化部分。
-
问题内容: 我试图在一个堆积条形图中“稳健地”居中数据标签。A下面给出了简单的代码和结果。如您所见,数据标签并不是所有的矩形都居中。我错过了什么? 问题答案: 你为什么写“va=”bottom“。
-
我有以下数据集,并使用Matplotlib绘制了一个堆叠条形图。 以下是生成图形的代码: 我需要注释图形中的值。例如,我需要每个条的值出现在图形的条内。请参阅下面的示例
-
问题内容: 这是为什么,我在绘制图表high bart中的数据时遇到麻烦。我正在使用它,但是当我提醒有值时,但是当我在条形图中绘制它时,它不会出现。我想知道我的代码是否以错误的方式?。这是我从barchart绘制点的代码: 我正在通过递归方式绘制图表,所以我代码的主要部分是: 我正在制作动态条形图表,这就是为什么首先要查询类别后绘制类别(月份)的原因, 在绘制类别之后,接下来是系列数据名称,在其中