
在堆积条形图Matplotlib中标注值

我有以下数据集,并使用Matplotlib绘制了一个堆叠条形图。
industry Distribution Manufacturing Retail Services
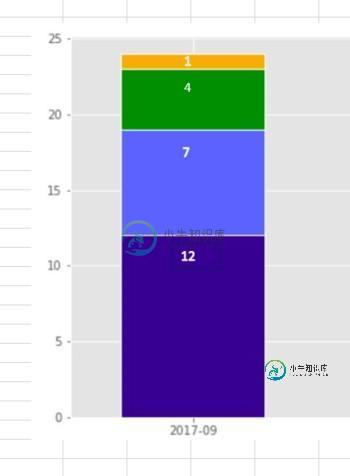
2017-09 1 4 12 7
2017-10 3 2 3 4
2017-11 1 0 2 1
2018-02 1 0 0 0
以下是生成图形的代码:
fig, ax = plt.subplots(1, figsize=(17,6))

part1 = ax.bar(industry_split.index.values, 'Retail', data=industry_split, color = 'darkblue', width=0.5, edgecolor=edgecolor, linewidth=linewidth)
part2 = ax.bar(industry_split.index.values, 'Services', data=industry_split, color = 'dodgerblue', edgecolor=edgecolor, linewidth=linewidth, width=0.5, bottom = industry_split.Retail)
part3 = ax.bar(industry_split.index.values, 'Manufacturing', data=industry_split, color = 'green', width=0.5, edgecolor=edgecolor, linewidth=linewidth, bottom = industry_split.Retail + industry_split.Services)
part4 = ax.bar(industry_split.index.values, 'Distribution', data=industry_split, color = 'orange', width=0.5, edgecolor=edgecolor, linewidth=linewidth, bottom = industry_split.Retail + industry_split.Services + industry_split.Manufacturing)
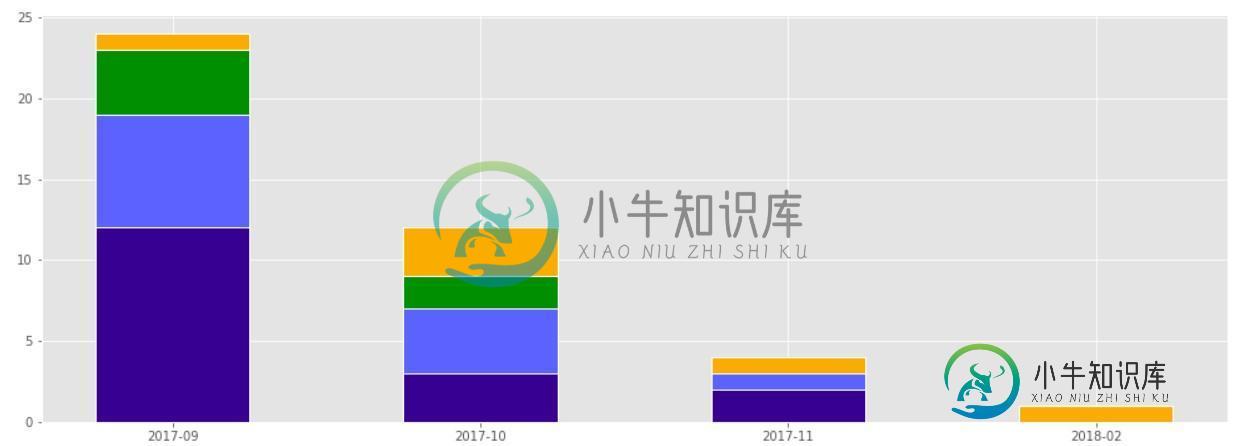
我需要注释图形中的值。例如,我需要每个条的值出现在图形的条内。请参阅下面的示例
共有1个答案

使用以下代码:
# Adding Data Labels
for i, label in enumerate(list(industry_split.index.values)):
score1 = industry_split.loc[label]['Retail']
if score1 == 0:
    None
else:
    ax.annotate(str(score1), (i, score1 - 0.7), color='white', fontsize=12, weight='semibold')

score2 = industry_split.loc[label]['Services']
if score2 == 0:
    None
else:
    ax.annotate(str(score2), (i, score1 + score2 - 0.7), color='white', fontsize=12, weight='semibold')

score3 = industry_split.loc[label]['Manufacturing']
if score3 == 0:
    None
else:
    ax.annotate(str(score3), (i, score1 + score2 + score3 - 0.7), color='white', fontsize=12, weight='semibold')

score4 = industry_split.loc[label]['Distribution']
if score4 == 0:
    None
else:
    ax.annotate(str(score4), (i, score1 + score2 + score3 + score4 - 0.7), color='white', fontsize=12, weight='semibold')
-
问题内容: 我正在尝试使用创建水平堆叠的条形图,但是我看不到如何使条形实际堆叠,而不是全部从y轴开始。 这是我的测试代码。 看到tcaswell的评论后,编辑使用kwarg。 这似乎是正确的方法,但是如果没有特定条形的数据,则尝试失败,因为它正尝试添加到随后返回的值。 问题答案: 由于您使用的是熊猫,因此值得一提的是,您可以在本地进行堆积条形图: 请参阅 文档的可视化部分。
-
问题内容: 我试图在一个堆积条形图中“稳健地”居中数据标签。A下面给出了简单的代码和结果。如您所见,数据标签并不是所有的矩形都居中。我错过了什么? 问题答案: 你为什么写“va=”bottom“。
-
StackedBarChart是BarChart的变体,它绘制了指示类别数据值的条形图。 条形可以是垂直的或水平的,这取决于哪个轴是类别轴。 每个系列的栏位于上一系列的顶部。 以下是堆积条形图,描绘了人口增长。 在JavaFX中,堆积条形图由名为StackedBarChart的类StackedBarChart 。 该类属于包javafx.scene.chart 。 通过实例化此类,您可以在Java
-
问题内容: 我使用以下代码处理了一个简单的3d条形图: 认为这只是一个测试,到目前为止,一切似乎都还很清楚。我只是想知道如何以堆叠的方式绘制这9个条形图的每一个,以便例如将每个条形图分成4个部分,组成整个条形图。 基本上,我想以此处的示例方式执行此操作。 但是,我希望有2个堆栈,而不是2个堆栈。有什么想法可以从我现在的角度出发吗?每个提示将不胜感激。 谢谢! 编辑:如果我想实现每个堆叠的酒吧给定的
-
问题内容: 如何添加值的标签以显示在条形图中的条形上方: 问题答案: 捕获绘图所在的轴,然后将其作为普通对象进行操作。将值放在条形上方将是这样的:
-
我有以下数据: 这导致了下图: 我需要在每个栏的顶部添加值。需要帮助吗?