
如何在此matplotlib图中固定条形宽度

有人可以告诉我如何修改此使用matplotlib的Python代码,以便无论绘制多少分,条的宽度都将保持恒定吗?先感谢您!
# data to plot
  n_groups = len(math_scores)
  ###print "im here", math_scores,verbal_scores
  scores_readingwriting = verbal_scores
  scores_math = math_scores

# create plot
  fig, ax = plot.subplots()
  index = np.arange(n_groups)
  bar_width = 0.35
  opacity = 0.8

  rects1 = plot.bar(index, scores_readingwriting, bar_width,
                 alpha=opacity,
                 color='black',
                 label='R/W')

  rects2 = plot.bar(index + bar_width, scores_math, bar_width,
                 alpha=opacity,
                 color='grey',
                 label='Math')

  plot.xlabel('Date',size='14')
  plot.ylabel('Scores',size='14')

  plot.title(str(first_names[i])+' '+str(last_names[i])+"'s History",size='17')
  num=len(scores)
  ###print datesofinterest
  plot.xticks(index + bar_width/2, datesofinterest,size='12')
  plot.yticks(size='12')
  axes = plot.gca()
  axes.set_ylim([200,800])
  plot.legend()

  plot.tight_layout()
  fig.savefig('img'+str(student_ids[i])+'.png')
问题答案:
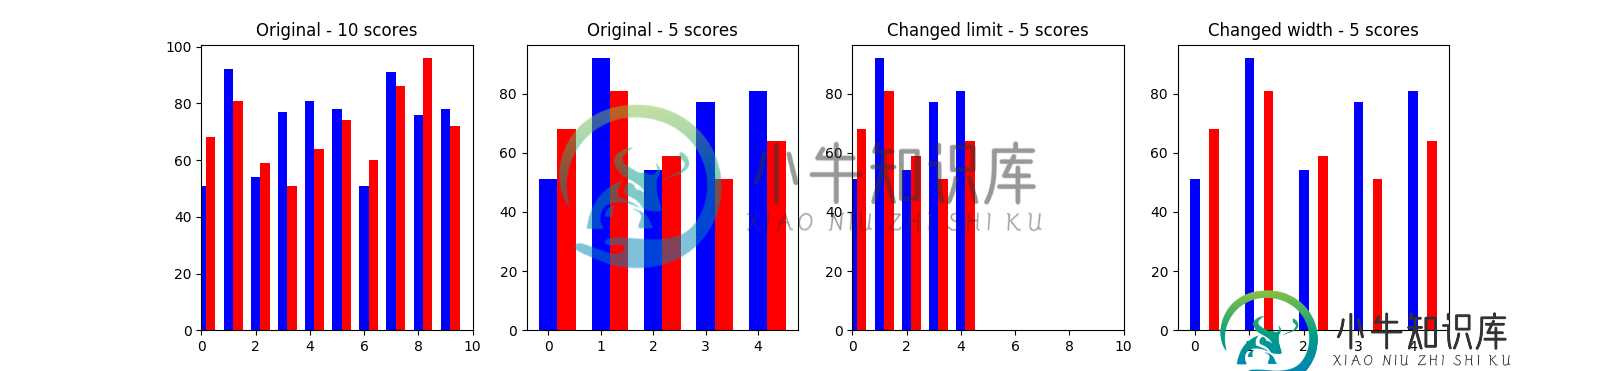
条的宽度相同!它们看起来不一样的原因是因为您正在使用以下行:
index = np.arange(n_groups)
这将更改您的x值,从而更改x轴的比例。为了抵消这种影响,您可以更改x轴的限制,也可以使条形宽度取决于分数的数量,例如,如果0.35的宽度适用于10个分数,那么如果将分数的数量加倍,条宽度的一半(反之亦然)。您可以看到更改轴限制或条宽度如何使条看起来相同的宽度:
import numpy as np
import matplotlib.pyplot as plt

# make some dummy data
scores_reading = np.random.randint(50,100,10)
scores_math = np.random.randint(50,100,10)

fig = plt.figure(figsize=(16,5))
bar_width = 0.35
index = np.arange(10)

ax1 = fig.add_subplot(1,4,1)
ax1.bar(index, scores_reading, bar_width, fc='b', edgecolor='none')
ax1.bar(index+bar_width, scores_math, bar_width, fc='r', edgecolor='none')
ax1.set_xlim(0,10)
ax1.set_title('Original - 10 scores')

ax2 = fig.add_subplot(1,4,2)
ax2.bar(index[:5], scores_reading[:5], bar_width, fc='b', edgecolor='none')
ax2.bar(index[:5]+bar_width, scores_math[:5], bar_width, fc='r', edgecolor='none')
ax2.set_title('Original - 5 scores')

ax3 = fig.add_subplot(1,4,3)
ax3.bar(index[:5], scores_reading[:5], bar_width, fc='b', edgecolor='none')
ax3.bar(index[:5]+bar_width, scores_math[:5], bar_width, fc='r', edgecolor='none')
ax3.set_xlim(0,10)
ax3.set_title('Changed limit - 5 scores')

ax4 = fig.add_subplot(1,4,4)
ax4.bar(index[:5], scores_reading[:5], bar_width/2., fc='b', edgecolor='none')
ax4.bar(index[:5]+bar_width, scores_math[:5], bar_width/2., fc='r', edgecolor='none')
ax4.set_title('Changed width - 5 scores')

fig.show()
-
我正在使用chartjs版本:2.1.4在MVC应用程序中创建图表。我正在使用控制条形图的宽度,以进行固定宽度设置。它在只有条形图的情况下工作正常,但在“堆叠条形图”的情况下,我无法确定条形图的宽度。我正在使用以下代码创建堆叠条形图,如下所示: 在这种情况下,"barper"属性不起作用。请在"chartjs版本: 2.1.4"中建议我解决方案。 提前谢谢
-
问题内容: 我在Matplotlib中制作条形图,调用如下: 有没有一种方法可以在Matplotlib中使用此功能来实现? 问题答案: 将添加为关键字参数。例如 。 这将垂直填充条形间隙。
-
我用Matplotlib做了一个条形图,调用如下: 我得到一个条形图,看起来像这样: 我想要的是在连续的条之间没有空白,例如,更像这样: 有没有办法在Matplotlib中使用函数来实现这一点?
-
问题内容: 简单方案: 我需要为设置一个固定宽度。我试过了: 也 对于 乃至 但是的宽度仍然相同。 问题答案: 对于Bootstrap 4.0: 在Bootstrap4.0.0中,您不能可靠地使用这些类(在Firefox中有效,但在Chrome中不适用)。您需要使用OhadR的答案: 对于Bootstrap 3.0: 在twitter bootstrap 3中使用:其中*是宽度的列数。 对于Boo
-
我正在尝试使用matplotlib创建条形图。 x轴数据是带有年份的列表:[19501960、19701、980、19901、995-2015] y轴数据是一个数量与年数相等的列表。 这是我的代码: 结果是:条与条之间有太多的空间 正如你所看到的,1950-1960年之间的差距是巨大的。我怎么能做到这一点,这样1950-1995年酒吧之间就没有间隙。我知道它的间隔为10年,但看起来并不好。 任何帮
-
我有以下数据集,并使用Matplotlib绘制了一个堆叠条形图。 以下是生成图形的代码: 我需要注释图形中的值。例如,我需要每个条的值出现在图形的条内。请参阅下面的示例