三十二、总结
优质
小牛编辑
131浏览
2023-12-01
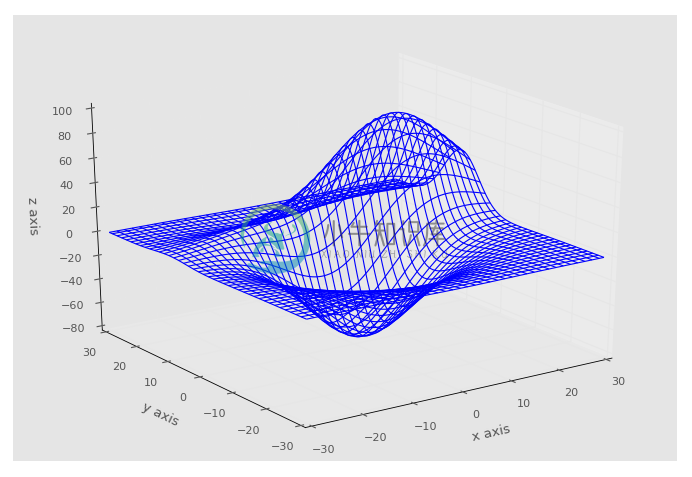
欢迎阅读最后的 Matplotlib 教程。 在这里我们将整理整个系列,并显示一个稍微更复杂的 3D 线框图:
from mpl_toolkits.mplot3d import axes3dimport matplotlib.pyplot as pltimport numpy as npfrom matplotlib import stylestyle.use('ggplot')fig = plt.figure()ax1 = fig.add_subplot(111, projection='3d')x, y, z = axes3d.get_test_data()print(axes3d.__file__)ax1.plot_wireframe(x,y,z, rstride = 3, cstride = 3)ax1.set_xlabel('x axis')ax1.set_ylabel('y axis')ax1.set_zlabel('z axis')plt.show()

如果你从一开始就关注这个教程的话,那么你已经学会了 Matplotlib 提供的大部分内容。 你可能不相信,但Matplotlib 仍然可以做很多其他的事情! 请继续学习,你可以随时访问 Matplotlib.org,并查看示例和图库页面。
如果你发现自己大量使用 Matplotlib,请考虑捐助给 John Hunter Memorial 基金。
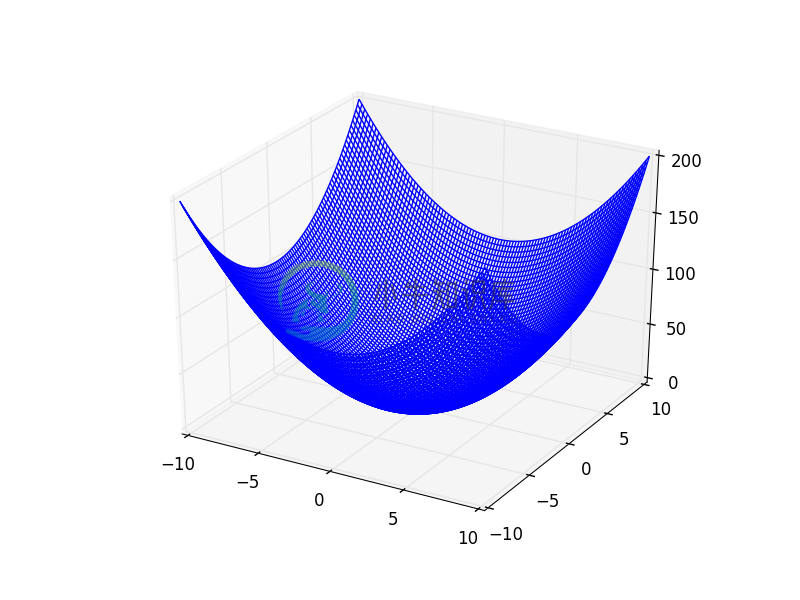
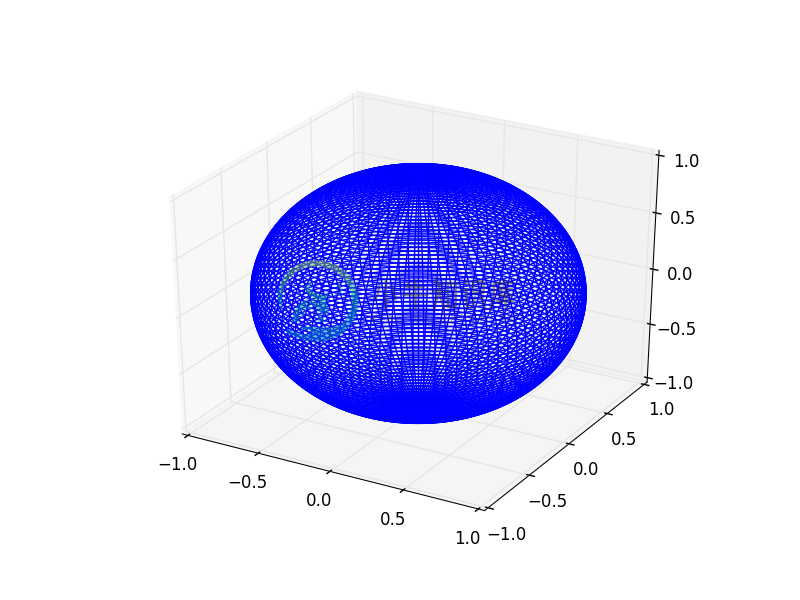
注:空间曲面的画法
# 二次抛物面 z = x^2 + y^2x = np.linspace(-10, 10, 101)y = xx, y = np.meshgrid(x, y)z = x ** 2 + y ** 2ax = plot.subplot(111, projection='3d')ax.plot_wireframe(x, y, z)plot.show()
# 半径为 1 的球t = np.linspace(0, np.pi * 2, 100)s = np.linspace(0, np.pi, 100)t, s = np.meshgrid(t, s)x = np.cos(t) * np.sin(s)y = np.sin(t) * np.sin(s)z = np.cos(s)ax = plot.subplot(111, projection='3d')ax.plot_wireframe(x, y, z)plot.show()


