javascript - js如何把下列数据处理成目标想要的数据 ?
js数据结构处理 后台返回的接口数据如下
{ "result": [ { "name": "参数1", "secondName": [ "高度", "马赫数" ] }, { "name": "参数2", "secondName": [ "前向", "垂向", "侧向" ] }, { "name": "参数3", "secondName": [ "前向", "垂向", "侧向" ] }, { "name": "参数4", "secondName": [ "前向", "垂向", "侧向" ] }, { "name": "参数5", "secondName": [ "前向", "垂向", "侧向" ] }, { "name": "参数6", "secondName": [ "前向", "垂向", "侧向" ] } ], "success": true}想把res.result变成如下格式
js数据结构处理后台返回的接口数据如下
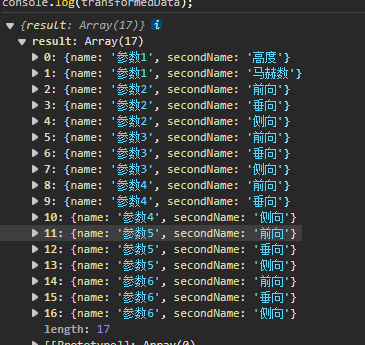
{ "result": [ { "name": "参数1", "secondName": ‘高度‘ }, { "name": "参数1", "secondName": ‘马赫数‘ }, { "name": "参数2", "secondName": "前向", }, { "name": "参数2", "secondName": "垂向", }, { "name": "参数2", "secondName": "侧向", }, }以此类推....
没有思路,求指点
共有2个答案
reduce功能很强大,可以学习下
result.reduce((arr, item) => arr.concat(item.secondName.map((sitem, sindex) => ({name: item.name, secondName: sitem, index: arr.length + sindex}))), [])let originalData = { "result": [ { "name": "参数1", "secondName": [ "高度", "马赫数" ] }, { "name": "参数2", "secondName": [ "前向", "垂向", "侧向" ] }, { "name": "参数3", "secondName": [ "前向", "垂向", "侧向" ] }, { "name": "参数4", "secondName": [ "前向", "垂向", "侧向" ] }, { "name": "参数5", "secondName": [ "前向", "垂向", "侧向" ] }, { "name": "参数6", "secondName": [ "前向", "垂向", "侧向" ] } ], "success": true};let transformedData = { result: []};for (let item of originalData.result) { for (let name of item.secondName) { transformedData.result.push({ name: item.name, secondName: name }); }}console.log(transformedData);
-
年代久远的项目,前台需要更新,后台因为没有人维护,所以数据结构无法更改 后台传递给前台的一个如下对象 要求把h0-h23的数据处理成echarts的x y轴的数据 例如 xData=["00:00","01:00"......] 一一对应
-
js数据处理 const translations = { 'editor.remove': 'Remove', 'editor.copy': 'Copy', 'editor.words': 'WORDS', 'editor.characters': 'CHARACTERS', 'editor.default': 'Default', 'editor.recent': 'Recently Used
-
// 最大值是1000 let num = 1000; num是最大数为1000,然后根据arr数组里面的test的值之和(3+4+5+6)为18, 1000 / 18 = 55(求整数); 然后需要得到的格式排列的数据如下: 麻烦各位大佬帮忙看看,写了循环,排列的数据格式不对,双循环的排列按顺序的话要怎么写?
-
js 数组的数据处理 这个2数字不是固定的, 如果a这个值是2 我需要得到arr为 arr = [9] 如果a这个值是4 我需要得到arr为 arr = [7,8,9] 大佬们帮我看看
-
let num = 600; num是最大数为600,然后根据arr数组里面的test的值之和(5+4+5+6)为20, 600 / 20 = 30; 希望得到下面的格式: 图片第一列5个输入框对应数组arr里面下标为0的test的值为5 图片第二列4个输入框对应数组arr里面下标为1的test的值为4 ... 控制1-30之间的随机数里面的输入框修改的时候只能输入1-30的数, 控制31-60之
-
(自己模拟的数据效果) 如上路径动画,目前的问题是运行的坐标数据是依照地图来的 需要转换为画布能够展示的范围,但运行数据之前差别大部分情况下都很小 我要怎样处理会合适一点? help大佬们

