问题:

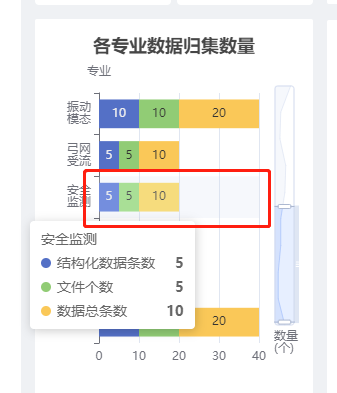
前端 - echart 柱体图,悬浮某个数据的时候会有灰蓝色的背景块,怎么去掉?
钱季

共有3个答案
包阳成
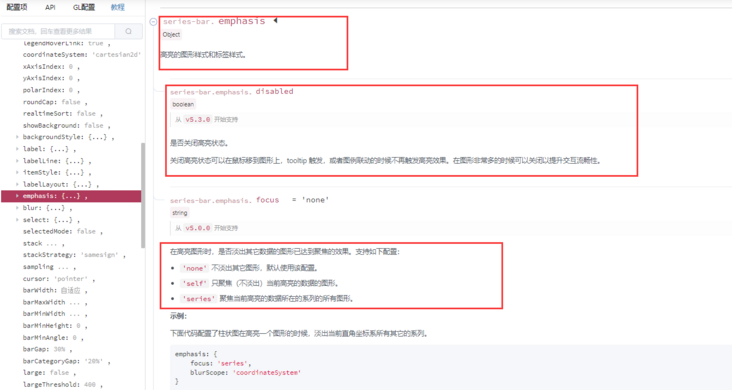
那是高亮时的样式,可以通过emphasis关闭

邢博涛
与series添加这个就行了:
  axisPointer: {
    show: false,
  },
https://echarts.apache.org/examples/zh/editor.html?c=bar-y-ca...
option = {
  xAxis: {
    type: 'category',
    data: ['Mon', 'Tue', 'Wed', 'Thu', 'Fri', 'Sat', 'Sun']
  },
  yAxis: {
    type: 'value'
  },
  series: [
    {
      data: [120, 200, 150, 80, 70, 110, 130],
      type: 'bar'
    }
  ]
};
连德义
axisPointer: {
      // Use axis to trigger tooltip
      type: 'shadow', // 'shadow' as default; can also be 'line' or 'shadow'
      shadowStyle: {
        // color: 'transparent'
        color: '#f00'
      }
    }
试试在 axisPointer 中添加 shadowStyle 属性
效果

类似资料:
-
通常情况下,当您使用或时,JTextField的背景/前景色会变成“灰色”。但是,如果之前使用设置了背景色(例如),那么调用或将不再影响背景色。相反,它会被先前设置的颜色覆盖。 在WinForms(.NET)中,这可以通过将背景颜色“重置”为非覆盖默认值来解决,即。这将导致文本框恢复标准行为。然而,我还没有为JTextField找到类似的“默认值”。当JTextField被禁用或设置为只读时,如何
-
图例: 因为是单柱多数据,导致myChart.on后params,会有两条。重复点甚至会有多条。目前只想获取点击对应一次params.name。 事件代码: 已解决 myChart.off('click') //!防止重复
-
现在的情况是这样,最后多出一个背景快,怎么去掉呢

