
创建具有精确大小且无填充的图形(以及轴外的图例)

我正试图为一篇科学文章制作一些数字,所以我希望我的数字有一个特定的大小。我还看到Matplotlib在默认情况下在图形的边框上添加了很多填充,这是我不需要的(因为图形将在白色背景上)。
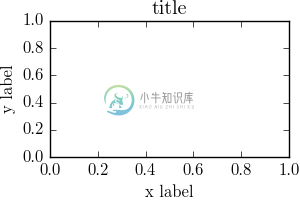
要设置特定的图形大小,我只需使用plt.figure(figsize=[w,h]),然后添加参数tight_layout={'pad':0},以删除填充。这非常有效,甚至在我添加标题、y/x标签等时也有效。示例:
fig = plt.figure(
    figsize = [3,2],
    tight_layout = {'pad': 0}
)
ax = fig.add_subplot(111)
plt.title('title')
ax.set_ylabel('y label')
ax.set_xlabel('x label')
plt.savefig('figure01.pdf')
这将创建一个精确大小为3x2(英寸)的pdf文件。
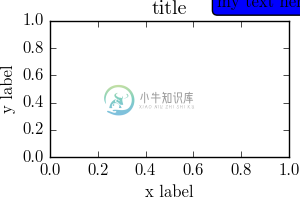
我遇到的问题是,例如,当我在轴之外添加文本框(通常是图例框)时,Matplotlib不会像添加标题/轴标签时那样为文本框腾出空间。通常,文本框被切断,或者根本不显示在保存的图形中。示例:
plt.close('all')
fig = plt.figure(
    figsize = [3,2],
    tight_layout = {'pad': 0}
)
ax = fig.add_subplot(111)
plt.title('title')
ax.set_ylabel('y label')
ax.set_xlabel('x label')
t = ax.text(0.7, 1.1, 'my text here', bbox = dict(boxstyle = 'round'))
plt.savefig('figure02.pdf')
我在SO的其他地方找到的一个解决方案是将参数bbox_inches='紧密'添加到Savefig命令中。文本框现在包含了我想要的,但是pdf现在大小错误。看起来Matplotlib只是让图形变大,而不是像添加标题和x/y标签时那样减小轴的大小。
例子:
plt.close('all')
fig = plt.figure(
    figsize = [3,2],
    tight_layout = {'pad': 0}
)
ax = fig.add_subplot(111)
plt.title('title')
ax.set_ylabel('y label')
ax.set_xlabel('x label')
t = ax.text(0.7, 1.1, 'my text here', bbox = dict(boxstyle = 'round'))
plt.savefig('figure03.pdf', bbox_inches = 'tight')
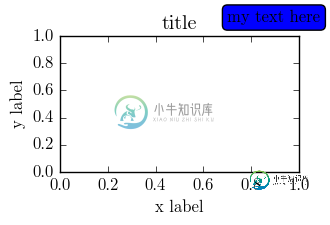
(这个数字是3.307x2.248)
是否有任何解决方案可以覆盖大多数情况下轴外的图例?
共有2个答案

从matplotlib==3.1.3开始,您可以使用constrated_layout=True来获得所需的结果。这目前是实验性的,但请参阅文档以获取非常有用的指南(以及专门关于图例的部分)。请注意,图例将从情节中窃取空间,但这是不可避免的。我发现,只要图例相对于绘图的大小不占用太多空间,那么图形就可以在不裁剪任何内容的情况下保存。
import matplotlib.pyplot as plt

fig, ax = plt.subplots(figsize=(3, 2), constrained_layout=True)
ax.set_title('title')
ax.set_ylabel('y label')
ax.set_xlabel('x label')
ax.plot([0,1], [0,1], label='my text here')
ax.legend(loc='center left', bbox_to_anchor=(1.1, 0.5))
fig.savefig('figure03.pdf')
保存的数字。

因此,要求如下:
- 具有固定的、预定义的图形大小
- 在轴外部添加文本标签或图例
- 轴和文本不能重叠
- 轴以及标题和轴标签紧靠在图形边框上
因此,使用pad=0的tight_布局,解决了1。四,。但与第2条相矛盾。
可以考虑将pad设置为较大的值。这将解决2。然而,由于它在所有方向上都是对称的,它将与4相矛盾。
使用bbox_inches='紧'更改图形大小。矛盾1.
所以我认为这个问题没有通用的解决方案。
我能想到的是:它在图形坐标中设置文本,然后在水平或垂直方向上调整轴的大小,以便轴和文本之间没有重叠。
import matplotlib.pyplot as plt
import matplotlib.transforms

fig = plt.figure(figsize = [3,2])
ax = fig.add_subplot(111)
plt.title('title')
ax.set_ylabel('y label')
ax.set_xlabel('x label')

def text_legend(ax, x0, y0, text, direction = "v", padpoints = 3, margin=1.,**kwargs):
    ha = kwargs.pop("ha", "right")
    va = kwargs.pop("va", "top")
    t = ax.figure.text(x0, y0, text, ha=ha, va=va, **kwargs)
    otrans = ax.figure.transFigure

    plt.tight_layout(pad=0)
    ax.figure.canvas.draw()
    plt.tight_layout(pad=0)
    offs =  t._bbox_patch.get_boxstyle().pad * t.get_size() + margin # adding 1pt
    trans = otrans + \
            matplotlib.transforms.ScaledTranslation(-offs/72.,-offs/72.,fig.dpi_scale_trans)
    t.set_transform(trans)
    ax.figure.canvas.draw()

    ppar = [0,-padpoints/72.] if direction == "v" else [-padpoints/72.,0]
    trans2 = matplotlib.transforms.ScaledTranslation(ppar[0],ppar[1],fig.dpi_scale_trans) + \
             ax.figure.transFigure.inverted()
    tbox = trans2.transform(t._bbox_patch.get_window_extent())
    bbox = ax.get_position()
    if direction=="v":
        ax.set_position([bbox.x0, bbox.y0,bbox.width, tbox[0][1]-bbox.y0])
    else:
        ax.set_position([bbox.x0, bbox.y0,tbox[0][0]-bbox.x0, bbox.height])

# case 1: place text label at top right corner of figure (1,1). Adjust axes height.
#text_legend(ax, 1,1, 'my text here', bbox = dict(boxstyle = 'round'), )

# case 2: place text left of axes, (1, y), direction=="v"
text_legend(ax, 1., 0.8, 'my text here', margin=2., direction="h", bbox = dict(boxstyle = 'round') )

plt.savefig(__file__+'.pdf')
plt.show()
import matplotlib.pyplot as plt
import matplotlib.transforms

fig = plt.figure(figsize = [3.5,2])
ax = fig.add_subplot(111)
ax.set_title('title')
ax.set_ylabel('y label')
ax.set_xlabel('x label')
ax.plot([1,2,3], marker="o", label="quantity 1")
ax.plot([2,1.7,1.2], marker="s", label="quantity 2")

def legend(ax, x0=1,y0=1, direction = "v", padpoints = 3,**kwargs):
    otrans = ax.figure.transFigure
    t = ax.legend(bbox_to_anchor=(x0,y0), loc=1, bbox_transform=otrans,**kwargs)
    plt.tight_layout(pad=0)
    ax.figure.canvas.draw()
    plt.tight_layout(pad=0)
    ppar = [0,-padpoints/72.] if direction == "v" else [-padpoints/72.,0]
    trans2=matplotlib.transforms.ScaledTranslation(ppar[0],ppar[1],fig.dpi_scale_trans)+\
             ax.figure.transFigure.inverted()
    tbox = t.get_window_extent().transformed(trans2 )
    bbox = ax.get_position()
    if direction=="v":
        ax.set_position([bbox.x0, bbox.y0,bbox.width, tbox.y0-bbox.y0])
    else:
        ax.set_position([bbox.x0, bbox.y0,tbox.x0-bbox.x0, bbox.height])

# case 1: place text label at top right corner of figure (1,1). Adjust axes height.
#legend(ax, borderaxespad=0)
# case 2: place text left of axes, (1, y), direction=="h"
legend(ax,y0=0.8, direction="h", borderaxespad=0.2)

plt.savefig(__file__+'.pdf')
plt.show()
-
假设我有一个大小为3841 x 7195像素的图像。我想将图中的内容保存到磁盘,从而得到我指定的像素大小的图像。 没有轴,就没有标题。只是图像而已。我个人并不关心DPI,因为我只想指定图像在屏幕上的大小(以磁盘为单位,以像素为单位)。 我读过其他线程,它们似乎都转换为英寸,然后以英寸为单位指定图形的尺寸,并以某种方式调整dpi。我希望避免处理像素到英寸转换可能导致的精度损失。 我尝试过: 运气不佳
-
如何更改图像的大小,使其适合打印? 例如,我想使用A4纸,其尺寸为横向11.7英寸乘8.27英寸。
-
我画正确的几个矩形与库vue-konva(我的项目是与Vue.js2)。 然而,我想用图像填充这些绘制的矩形。vue-konva文档说使用属性,但它不起作用 这是我的代码 模板: 脚本: png的路径是正确的。如果在我的模板中放置一个img标记,并在src中使用上述路径,我可以看到我的图像。 您可以在以下网址测试代码示例:https://codesandbox.io/s/6x1r9jxklz 为什
-
我可以在Google地图中绘制多边形。现在,当我在地图上绘制完该区域的多边形时,我想用相同的图标填充该多边形。我可以用颜色填充多边形,但我想用边框有一些填充和图标之间有一些指定空间的图标填充它。我该怎么做?
-
我试图从python脚本中的两个列表创建一个简单的条形图。但是,当数据填充到plotly系统中时,不会显示任何图形。下面是我编写的代码、列表的内容以及Plotly生成的代码。也许这是一种在填充图之前需要以某种方式拆分列表的情况?请原谅,这是一个新手问题,我以前从未尝试过。如有任何想法,将不胜感激。 脚本代码: 列表内容: 由Ploly创建的代码:
-
问题内容: 我需要将图片调整为固定大小。但它必须将宽度和高度之间的因素。 说我要调整从图片到 我现在要做的是: 现在我考虑最小的因素。 从那以后我一直都有正确的宽度。但是身高还是。 如何在不破坏图片的情况下降低高度? 我需要修剪吗?如果可以,怎么办? 问题答案: 这个解决方案与Can BerkGüder的解决方案基本相同,但是花了一些时间写和发表评论后,我才觉得喜欢发布。 此功能创建的缩略图与您提