
Jfreechart:在甘特图中绘制线箭头

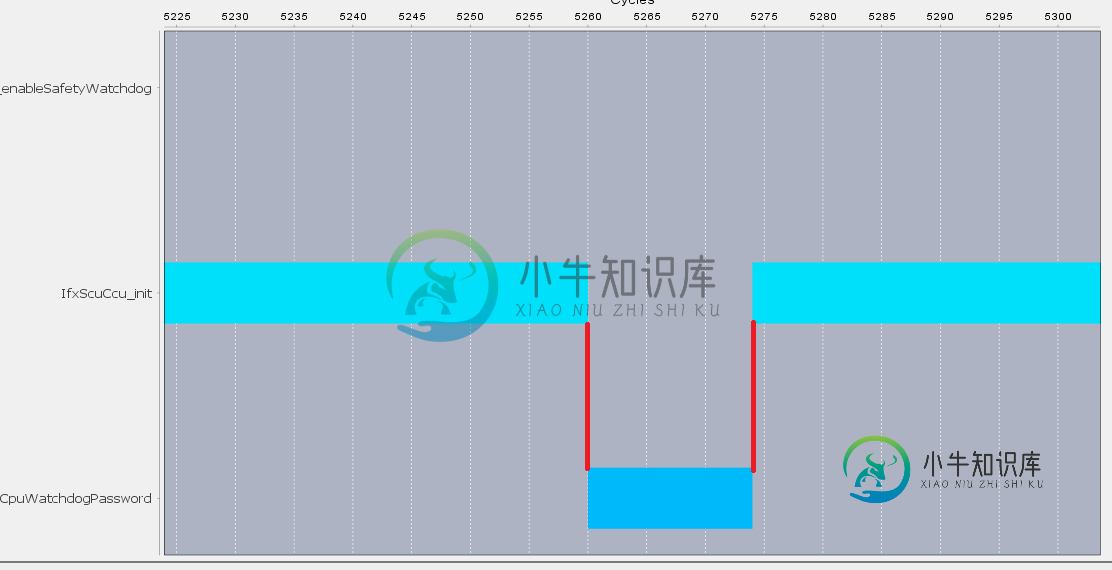
我想画一些垂直线来跟踪任务,如下图中的红线所示。我相信可以使用甘特图绘制器绘制线条。
我想要的是在绘制任务期间存储直线endpoint的坐标,然后最终在绘图中绘制这些直线。
我想知道是否有一种方法可以让你在绘图上绘制任何东西,以及这是否是解决这个问题的正确方法。
以下是我的甘特图渲染器代码:
public class Renderer extends GanttRenderer {


    private Color markerColorChannel = Color.BLUE;
    private Color markerColorFunction = new Color(138,43,226);
    private Color functionDurationMarkerColor = new Color(0,100,0);
    private boolean functionTrace = false;
    private List<ProcessorTask> listOfDrawingTask = new ArrayList<ProcessorTask>();

    /**
     * CONSTRUCTOR
     *
     * @param model
     */
    public Renderer() {


    }

    /**
     * This method is used to draw the task/subtasks for each channel or row item.
     * The method is called each time the gannt chart is repainted: including zooming,
     * sliding and changes to gannt chart input configurations.
     *
     * @param g2 The graphics device.
     * @param state The renderer state.
     * @param dataArea The data plot area.
     * @param plot The plot.
     * @param domainAxis The domain axis.
     * @param rangeAxis The range axis.
     * @param dataset The set of data to be drawn
     * @param row The row index (zero-based).
     * @param column Indicates the index of the task item to be drawn (starts from zero)
     */
    // DRAW TASKS
    @Override
    protected void drawTasks(Graphics2D g2, CategoryItemRendererState state, Rectangle2D dataArea, CategoryPlot plot, CategoryAxis domainAxis,
            ValueAxis rangeAxis, GanttCategoryDataset dataset, int row, int column) {

        try {

//          plot.setDomainCrosshairVisible(true);
//          plot.setRangeCrosshairVisible(true);

//           System.out.println("ROW: " + row + " COL: " + column + " time " + System.currentTimeMillis());

             /* Get the total number of subtasks in the channel or row item*/
            int count = dataset.getSubIntervalCount(row, column);

            /* If the item contains no subtask the count is zero. Then draw only the single task. */
            if (count == 0) {
                drawTask(g2, state, dataArea, plot, domainAxis, rangeAxis, dataset, row, column);
            }

            /*If the item contains subtasks, loop through each of them*/
            for (int subinterval = 0; subinterval < count; subinterval++) {

                RectangleEdge rangeAxisLocation = plot.getRangeAxisEdge();
                Number subtaskStart;    // start time
                Number subtaskEnd;      // end time
                double subtaskStartTranslated;
                double subtaskEndTranslated;

                /* Sub task start time */
                subtaskStart = dataset.getStartValue(row, column, subinterval);
                if (subtaskStart == null) {
                    System.out.println("No starting time for subtask " + subinterval + " item " + column + " found!");
                    return;
                }
                subtaskStartTranslated = rangeAxis.valueToJava2D(subtaskStart.doubleValue(), dataArea, rangeAxisLocation);

                /* Sub task end time */
                subtaskEnd = dataset.getEndValue(row, column, subinterval);
                if (subtaskEnd == null) {
                    System.out.println("No end time for subtask " + subinterval + " item " + column + " found!");
                    return;
                }
                subtaskEndTranslated = rangeAxis.valueToJava2D(subtaskEnd.doubleValue(), dataArea, rangeAxisLocation);


                /*Set the rectangular bar properties*/
                double rectYAxisStart;
                double rectLength;
                double rectBreadth;
                Rectangle2D bar = null;
                Number percent; // task percentage completion

                rectYAxisStart = calculateBarW0(plot, plot.getOrientation(), dataArea, domainAxis, state, row, column);
                rectLength = Math.abs(subtaskEndTranslated - subtaskStartTranslated);
                rectBreadth = state.getBarWidth();
                percent = dataset.getPercentComplete(row, column, subinterval);

                /*Draw the rectangular bar*/
                if (plot.getOrientation() == PlotOrientation.HORIZONTAL) {      // horizontal is applied for the ganntchart
                    bar = new Rectangle2D.Double(subtaskStartTranslated, rectYAxisStart, rectLength, rectBreadth);
                } else if (plot.getOrientation() == PlotOrientation.VERTICAL) {
                    bar = new Rectangle2D.Double(rectYAxisStart, subtaskStartTranslated, rectBreadth, rectLength);
                }


                /*Drawing the task completion bar in the subtask bar:
                 * This feature is currently not needed in the gantt chart*/

                /* Painting the task/subtask */
                Paint seriesPaint = getItemPaint(row, column, subinterval);
                g2.setPaint(seriesPaint);
                g2.fill(bar);

                if (isDrawBarOutline() && state.getBarWidth() > BAR_OUTLINE_WIDTH_THRESHOLD) {
                    g2.setStroke(getItemStroke(row, column));
                    g2.setPaint(getItemOutlinePaint(row, column));
                    g2.draw(bar);

                }


            }

        } catch (Exception e) {
            e.printStackTrace();
        }
    }

    /**
     * This method is used to paint the subtasks of a channel or row item
     * @param row
     * @param col Index of the channel or the row item
     * @param subinterval   Index of the subtask
     * @return  Paint Item
     */
    private Paint getItemPaint(int row, int col, int subinterval) {
        return this.listOfDrawingTask.get(col).getSubTaskColorList().get(subinterval);
    }
}
更新:
似乎LineAnnotics是实现这些行的最佳方式。Link1
共有1个答案

可以使用类别注释将这些线添加到甘特图上。线注释将添加到绘图中。
 CategoryPlot plot = (CategoryPlot) chart.getPlot();
 plot.addAnnotation(new CategoryLineAnnotation("Category 2", 5.0,
          "Category 4", 8.0, Color.red, new BasicStroke(2.0f)));
以下是David Gilbert的MCV示例:
        /* ===========================================================
        * JFreeChart : a free chart library for the Java(tm) platform
        * ===========================================================
        *
        * (C) Copyright 2000-2007, by Object Refinery Limited and Contributors.
        *
        * Project Info:  http://www.jfree.org/jfreechart/index.html
        *
        * This library is free software; you can redistribute it and/or modify it
        * under the terms of the GNU Lesser General Public License as published by
        * the Free Software Foundation; either version 2.1 of the License, or
        * (at your option) any later version.
        *
        * This library is distributed in the hope that it will be useful, but
        * WITHOUT ANY WARRANTY; without even the implied warranty of MERCHANTABILITY
        * or FITNESS FOR A PARTICULAR PURPOSE. See the GNU Lesser General Public
        * License for more details.
        *
        * You should have received a copy of the GNU Lesser General Public
        * License along with this library; if not, write to the Free Software
        * Foundation, Inc., 51 Franklin Street, Fifth Floor, Boston, MA  02110-1301,
        * USA.
        *
        * [Java is a trademark or registered trademark of Sun Microsystems, Inc.
        * in the United States and other countries.]
        *
        * ------------------
        * BarChartDemo1.java
        * ------------------
        * (C) Copyright 2003-2007, by Object Refinery Limited and Contributors.
        *
        * Original Author:  David Gilbert (for Object Refinery Limited);
        * Contributor(s):   ;
        *
        * Changes
        * -------
        * 09-Mar-2005 : Version 1 (DG);
        *
        */

        package org.jfree.chart.demo;

        import java.awt.BasicStroke;
        import java.awt.Color;
        import java.awt.Dimension;
        import java.awt.GradientPaint;

        import org.jfree.chart.ChartFactory;
        import org.jfree.chart.ChartPanel;
        import org.jfree.chart.JFreeChart;
        import org.jfree.chart.annotations.CategoryLineAnnotation;
        import org.jfree.chart.axis.CategoryAxis;
        import org.jfree.chart.axis.CategoryLabelPositions;
        import org.jfree.chart.axis.NumberAxis;
        import org.jfree.chart.plot.CategoryPlot;
        import org.jfree.chart.plot.PlotOrientation;
        import org.jfree.chart.renderer.category.BarRenderer;
        import org.jfree.data.category.CategoryDataset;
        import org.jfree.data.category.DefaultCategoryDataset;
        import org.jfree.ui.ApplicationFrame;
        import org.jfree.ui.RefineryUtilities;

        /**
        * A simple demonstration application showing how to create a bar chart.
        */
        public class BarChartDemo1 extends ApplicationFrame {

            /**
             * Creates a new demo instance.
             *
             * @param title  the frame title.
             */
            public BarChartDemo1(String title) {
                super(title);
                CategoryDataset dataset = createDataset();
                JFreeChart chart = createChart(dataset);
                ChartPanel chartPanel = new ChartPanel(chart, false);
                chartPanel.setPreferredSize(new Dimension(500, 270));
                setContentPane(chartPanel);
            }

            /**
             * Returns a sample dataset.
             *
             * @return The dataset.
             */
            private static CategoryDataset createDataset() {

                // row keys...
                String series1 = "First";
                String series2 = "Second";
                String series3 = "Third";

                // column keys...
                String category1 = "Category 1";
                String category2 = "Category 2";
                String category3 = "Category 3";
                String category4 = "Category 4";
                String category5 = "Category 5";

                // create the dataset...
                DefaultCategoryDataset dataset = new DefaultCategoryDataset();

                dataset.addValue(1.0, series1, category1);
                dataset.addValue(4.0, series1, category2);
                dataset.addValue(3.0, series1, category3);
                dataset.addValue(5.0, series1, category4);
                dataset.addValue(5.0, series1, category5);

                dataset.addValue(5.0, series2, category1);
                dataset.addValue(7.0, series2, category2);
                dataset.addValue(6.0, series2, category3);
                dataset.addValue(8.0, series2, category4);
                dataset.addValue(4.0, series2, category5);

                dataset.addValue(4.0, series3, category1);
                dataset.addValue(3.0, series3, category2);
                dataset.addValue(2.0, series3, category3);
                dataset.addValue(3.0, series3, category4);
                dataset.addValue(6.0, series3, category5);

                return dataset;

            }

            /**
             * Creates a sample chart.
             *
             * @param dataset  the dataset.
             *
             * @return The chart.
             */
            private static JFreeChart createChart(CategoryDataset dataset) {

                // create the chart...
                JFreeChart chart = ChartFactory.createBarChart(
                    "Bar Chart Demo 1",       // chart title
                    "Category",               // domain axis label
                    "Value",                  // range axis label
                    dataset,                  // data
                    PlotOrientation.VERTICAL, // orientation
                    true,                     // include legend
                    true,                     // tooltips?
                    false                     // URLs?
                );

                // NOW DO SOME OPTIONAL CUSTOMISATION OF THE CHART...

                // set the background color for the chart...
                chart.setBackgroundPaint(Color.white);

                // get a reference to the plot for further customisation...
                CategoryPlot plot = (CategoryPlot) chart.getPlot();
                plot.setBackgroundPaint(Color.lightGray);
                plot.setDomainGridlinePaint(Color.white);
                plot.setDomainGridlinesVisible(true);
                plot.setRangeGridlinePaint(Color.white);

                plot.addAnnotation(new CategoryLineAnnotation("Category 2", 5.0,
                      "Category 4", 8.0, Color.red, new BasicStroke(2.0f)));

                // ******************************************************************
                //  More than 150 demo applications are included with the JFreeChart
                //  Developer Guide...for more information, see:
                //
                //  >   http://www.object-refinery.com/jfreechart/guide.html
                //
                // ******************************************************************

                // set the range axis to display integers only...
                final NumberAxis rangeAxis = (NumberAxis) plot.getRangeAxis();
                rangeAxis.setStandardTickUnits(NumberAxis.createIntegerTickUnits());

                // disable bar outlines...
                BarRenderer renderer = (BarRenderer) plot.getRenderer();
                renderer.setDrawBarOutline(false);

                // set up gradient paints for series...
                GradientPaint gp0 = new GradientPaint(0.0f, 0.0f, Color.blue,
                        0.0f, 0.0f, new Color(0, 0, 64));
                GradientPaint gp1 = new GradientPaint(0.0f, 0.0f, Color.green,
                        0.0f, 0.0f, new Color(0, 64, 0));
                GradientPaint gp2 = new GradientPaint(0.0f, 0.0f, Color.red,
                        0.0f, 0.0f, new Color(64, 0, 0));
                renderer.setSeriesPaint(0, gp0);
                renderer.setSeriesPaint(1, gp1);
                renderer.setSeriesPaint(2, gp2);

                CategoryAxis domainAxis = plot.getDomainAxis();
                domainAxis.setCategoryLabelPositions(
                        CategoryLabelPositions.createUpRotationLabelPositions(
                                Math.PI / 6.0));
                // OPTIONAL CUSTOMISATION COMPLETED.

                return chart;

            }

            /**
             * Starting point for the demonstration application.
             *
             * @param args  ignored.
             */
            public static void main(String[] args) {
                BarChartDemo1 demo = new BarChartDemo1("Bar Chart Demo 1");
                demo.pack();
                RefineryUtilities.centerFrameOnScreen(demo);
                demo.setVisible(true);
            }

        }
-
有人知道如何在甘特图中的特定位置移动/绘制虚线吗?例如,我有这样的图表: 链接到图像 很难看到任务1和任务2以及任务3在哪里。 如果可能的话,画水平线不是在1,2,3线,而是在整个系列之后,以明确视觉分隔符。 谢谢
-
主要内容:什么是JFreeChart 甘特图,JFreeChart 甘特图的示例什么是JFreeChart 甘特图 甘特图是一种条形图,常用于计划和安排项目任务和事件。 下图显示了 JFreeChart 库中包含的甘特图的一些演示版本: JFreeChart 甘特图的示例 让我们以人口数量作为样本数据。 软件开发阶段 预计日期 实际日期 需求分析 2017-07-03 2017-07-07 2017-07-03 2017-07-05 需求设计 2017-07-10 201
-
我想创建交互式甘特图(或序列图),用于显示多个处理器上的任务调度。 我找到了这个库,它产生了非常好的交互式甘特图。不幸的是,ploly-Gantt只适用于日期而不是数值,就像我对计划的运行时值所做的那样。 有没有可能用数值绘制甘特图? 代码示例:(我想使用这样的东西)
-
主要内容:示例可以使用类的方法在图像上绘制箭头线。 以下是这种方法的语法 - 该方法接受以下参数 - mat - 表示要在其上绘制矩形的图像的对象。 pt1 和 pt2 - 两个对象,表示要绘制的矩形的顶点。 color - 表示矩形颜色的标量对象(BGR)。 示例 以下程序演示如何在图像上绘制箭头线并使用JavaFX窗口显示它。 执行上面示例代码,您将会看到以下结果 -
-
这些是输入数据("test.data")的几个留置权: 我使用此代码绘制甘特图: 输出如下所示: 我想知道,我怎样才能从绿色矩形的两侧去掉那些白点?或者至少改变他们的颜色?
-
带有高图的GANTT图表示例:http://jsfiddle.net/gh/get/jquery/1.7.2/highslide-software/highcharts.com/tree/master/samples/highcharts/studies/xrange-series/ 我试着用这样一个里程碑的例子。 我的代码目前看起来像这样: 编辑:我希望它看起来像什么样的模型示例: http:/