
如何使用grafana可视化prometheusendpoint度量

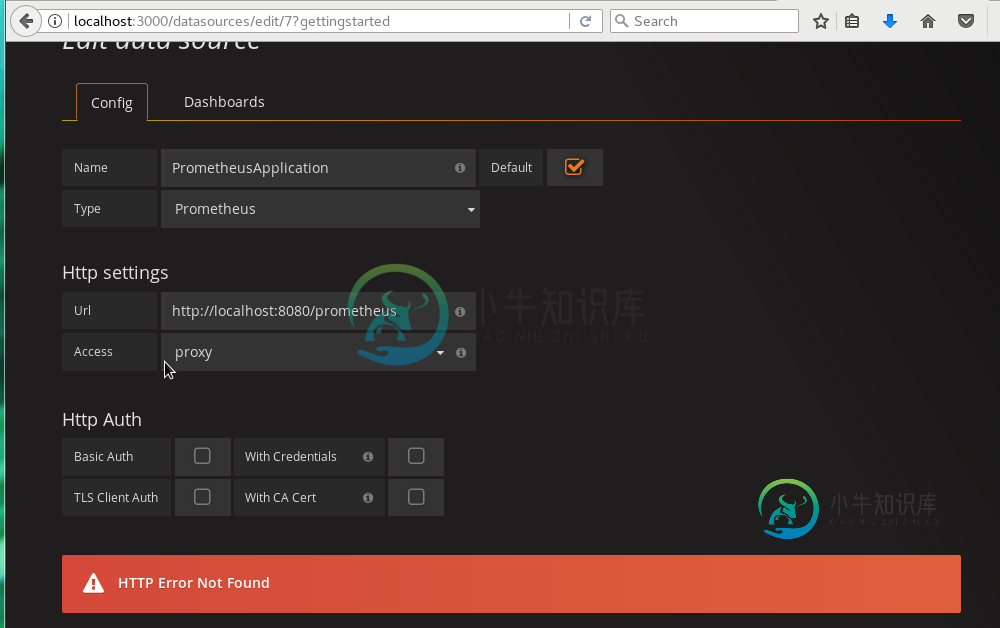
我有一个简单的spring引导应用程序(使用Maven),我使用Prometheus对其进行了检测,以收集特定于应用程序的度量。默认情况下,检测的Prometheus度量在http://localhost:8080/Prometheus上公开,但我不确定如何在Grafana上可视化这些度量。当我尝试在Grafana中设置datasource时,我得到一个错误:
找不到HTTP错误
下面是我的工作代码,它公开了http://localhost:8080/prometheus上的度量
java:只公开几个endpoint。以便Prometheus计算/homepageendpoint被命中的次数。
@SpringBootApplication
@RestController
public class Example {

    //Just a logger that keeps track of relevant information:
    private static final Logger LOGGER = Logger.getLogger(Example.class.getName());

    //counter for counting how many times an endpoint has been hit
    static final Counter myCounter = Counter.build()
                                              .name("CounterName") //note: by convention, counters should have "_total" suffix
                                              .help("Total requests recorded by a specific endpoint")
                                              .labelNames("status")
                                              .register();

    //using a guage to set the time that a dummy process started, store the time it ends, and then calculate
    //the elapsed time between when the process started and when the process ended.
    static final Gauge myGauge =  Gauge.build()
                                .name("GaugeName")
                                .help("This is the Gauge help message")
                                .labelNames("label1")
                                .register();

    @RequestMapping("/hello")
    String hello() {

        myCounter.labels("customLabel1").inc(); //increment the number of requests by one
        myGauge.labels("customLabel1").inc(3);
        LOGGER.log(Level.INFO, "Number of times /hello has been hit: " + myCounter.labels("customLabel1").get());
        LOGGER.log(Level.INFO, "Size of our Gauge: " + myGauge.labels("customLabel1").get());
        myGauge.labels("customLabel1").dec();
        LOGGER.log(Level.INFO, "size of out Gauge after decrementing by 1: " + myGauge.labels("customLabel1").get());

        return "Hello world! This is an example response!";
    }

    @RequestMapping("/homepage")
    String homePage() {

        myCounter.labels("customLabel2").inc(); //increment the number of requests by one
        LOGGER.log(Level.INFO, "Number of times /homepage has been hit: " + myCounter.labels("customLabel2").get());

        return "this is the home page!!";
    }


    public static void main(String[] args) throws Exception {
        SpringApplication.run(Example.class, args);
    }

}
MonitoringConfig.java:这是Prometheus收集应用程序度量信息的方式,并在localhostl8080/Prometheus上公开这些信息
@Configuration
public class MonitoringConfig {
    @Bean
    SpringBootMetricsCollector springBootMetricsCollector(Collection<PublicMetrics> publicMetrics){
        SpringBootMetricsCollector springBootMetricsCollector = new SpringBootMetricsCollector(publicMetrics);
        springBootMetricsCollector.register();

        return springBootMetricsCollector;
    }

    @Bean
    ServletRegistrationBean servletRegistrationBean() {
        DefaultExports.initialize();
        return new ServletRegistrationBean(new MetricsServlet(), "/prometheus");
    }
}
pom.xml:项目的Maven依赖项
<?xml version="1.0" encoding="UTF-8"?>
<project xmlns="http://maven.apache.org/POM/4.0.0" xmlns:xsi="http://www.w3.org/2001/XMLSchema-instance"
    xsi:schemaLocation="http://maven.apache.org/POM/4.0.0 http://maven.apache.org/xsd/maven-4.0.0.xsd">
    <modelVersion>4.0.0</modelVersion>

    <groupId>com.example</groupId>
    <artifactId>springboot</artifactId>
    <version>0.0.1-SNAPSHOT</version>

    <parent>
        <groupId>org.springframework.boot</groupId>
        <artifactId>spring-boot-starter-parent</artifactId>
        <version>1.5.8.RELEASE</version>
    </parent>
    <dependencies>
        <dependency>
            <groupId>org.springframework.boot</groupId>
            <artifactId>spring-boot-starter-web</artifactId>
        </dependency>

        <!-- Prometheus dependencies -->
        <!-- The client -->
        <dependency>
            <groupId>io.prometheus</groupId>
            <artifactId>simpleclient</artifactId>
            <version>0.1.0</version>
        </dependency>

        <dependency>
            <groupId>io.prometheus</groupId>
            <artifactId>simpleclient_spring_boot</artifactId>
            <version>0.1.0</version>
        </dependency>

        <dependency>
            <groupId>io.prometheus</groupId>
            <artifactId>simpleclient_servlet</artifactId>
            <version>0.1.0</version>
        </dependency>
        <!-- Hotspot JVM metrics -->
        <dependency>
            <groupId>io.prometheus</groupId>
            <artifactId>simpleclient_hotspot</artifactId>
            <version>0.1.0</version>
        </dependency>
        <!-- Exposition HTTPServer -->
        <dependency>
            <groupId>io.prometheus</groupId>
            <artifactId>simpleclient_httpserver</artifactId>
            <version>0.1.0</version>
        </dependency>
        <!-- Pushgateway exposition -->
        <dependency>
            <groupId>io.prometheus</groupId>
            <artifactId>simpleclient_pushgateway</artifactId>
            <version>0.1.0</version>
        </dependency>

        <!-- Spring Boot Actuator for exposing metrics -->
        <dependency>
            <groupId>org.springframework.boot</groupId>
            <artifactId>spring-boot-starter-actuator</artifactId>
            <version>1.5.8.RELEASE</version>
        </dependency>

    </dependencies>


</project>
共有1个答案

您需要将grafana指向prometheus服务器,而不是您的应用程序。
有关如何运行普罗米修斯和如何在grafana仪表板中可视化普罗米修斯度量的更多细节,请参阅普罗米修斯文档。
-
在Python和函数的帮助下,我能够从URL中获取数据。数据包含一个实例列表,其中每个实例都有instance_id、状态等指标。 我的问题是,我有没有办法将这些指标上传到普罗米修斯?我查看了pushgateway功能,但不确定这是否是进行数据推送和存储的正确方法。 我目前向普罗米修斯推送数据的工作如下: 但是,我不确定我应该推动什么公制类型(仪表,摘要或其他东西?) 下面是我希望推送的实例数据示
-
这个任务展示了如何设置和使用Istio Dashboard对Service Mesh中的流量进行监控。作为这个任务的一部分,需要安装Grafana的Istio插件,然后使用Web界面来查看Service Mesh的流量数据。 开始之前 在集群上安装Istio并部署一个应用。 安装Prometheus插件。 kubectl apply -f install/kubernetes/addons/p
-
我已经为我的spring boot应用程序配置了测微计和prometheus,我可以在endpoint/执行器/prometheus处看到以下指标(使用计时器生成): 但当我在Grafana中运行其中一个查询(针对prometheus实例配置)时,我没有看到任何结果。 这需要任何配置吗?
-
可视化页面是由一系列可视化元素组合而成,而可视化页面是否好看合理是由如下几点决定: 突出重点的版面布局、合理的配色方案、精巧的区域点缀、强化的动效加持,但是在这些之前,我们需要根据业务的需求,选择合理的可视化表达元素。 根据经验,我们将可视化元素分类为两类: 信息类图表 统计类图表 信息类图表 信息图是一个合成,由信息和图表两个词组成,信息是需要表达的具体文本内容,图是强化信息理解的工具。 广义上
-
wps excel 怎么根据表中中某列的数据生成这样的图标,数据如第一张图中右侧的百分比,第二张图是理想图标,希望大佬们给个方案或者方案链接。 找了一些方案,主要还是不知道怎么弄这种图和把表格中数据作为图标数据
-
我是micrometer和prometheus的新手,我正在尝试构建我的第一个应用程序,使用micrometer和prometheus作为监控后端进行监控。但我看不到prometheusendpoint上显示的应用程序(和)的度量。 我正在学习普罗米修斯的教程。我也跟着这个视频开始千分尺。 我从这个链接下载了prometheus,提取了它,然后使用命令:运行prometheus来报废。我正在此配置