TensorBoard: Visualizing Learning
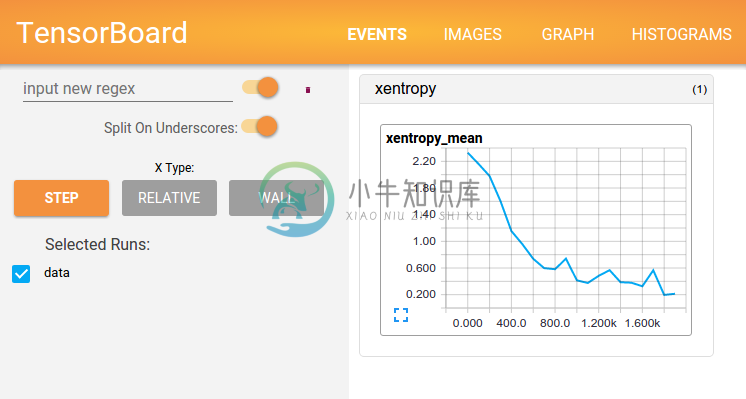
The computations you'll use TensorBoard for - like training a massive deep neural network - can be complex and confusing. To make it easier to understand, debug, and optimize TensorFlow programs, we've included a suite of visualization tools called TensorBoard. You can use TensorBoard to visualize your TensorFlow graph, plot quantitative metrics about the execution of your graph, and show additional data like images that pass through it. When TensorBoard is fully configured, it looks like this:

Serializing the data
TensorBoard operates by reading TensorFlow events files, which contain summary data that you can generate when running TensorFlow. Here's the general lifecycle for summary data within TensorBoard.
First, create the TensorFlow graph that you'd like to collect summary data from, and decide which nodes you would like to annotate with [summary operations] (../../api_docs-python-train.md#summary-operations).
For example, suppose you are training a convolutional neural network for recognizing MNIST digits. You'd like to record how the learning rate varies over time, and how the objective function is changing. Collect these by attaching scalar_summary ops to the nodes that output the learning rate and loss respectively. Then, give each scalar_summary a meaningful tag, like 'learning rate' or 'loss function'.
Perhaps you'd also like to visualize the distributions of activations coming off a particular layer, or the distribution of gradients or weights. Collect this data by attaching histogram_summary ops to the gradient outputs and to the variable that holds your weights, respectively.
For details on all of the summary operations avaiable, check out the docs on [summary operations] (../../api_docs-python-train.md#summary-operations).
Operations in TensorFlow don't do anything until you run them, or an op that depends on their output. And the summary nodes that we've just created are peripheral to your graph: none of the ops you are currently running depend on them. So, to generate summaries, we need to run all of these summary nodes. Managing them by hand would be tedious, so use tf.merge_all_summaries to combine them into a single op that generates all the summary data.
Then, you can just run the merged summary op, which will generate a serialized Summary protobuf object with all of your summary data at a given step. Finally, to write this summary data to disk, pass the summary protobuf to a tf.train.SummaryWriter.
The SummaryWriter takes a logdir in its constructor - this logdir is quite important, it's the directory where all of the events will be written out. Also, the SummaryWriter can optionally take a GraphDef in its constructor. If it receives one, then TensorBoard will visualize your graph as well.
Now that you've modified your graph and have a SummaryWriter, you're ready to start runing your network! If you want, you could run the merged summary op every single step, and record a ton of training data. That's likely to be more data than you need, though. Instead, consider running the merged summary op every hundred steps or so, as in the following code example.
merged_summary_op = tf.merge_all_summaries()
summary_writer = tf.train.SummaryWriter('/tmp/mnist_logs', sess.graph)
total_step = 0
while training:
  total_step += 1
  session.run(training_op)
  if total_step % 100 == 0:
    summary_str = session.run(merged_summary_op)
    summary_writer.add_summary(summary_str, total_step)
You're now all set to visualize this data using TensorBoard.
Launching TensorBoard
To run TensorBoard, use the command
python tensorflow/tensorboard/tensorboard.py --logdir=path/to/log-directorywhere logdir points to the directory where the SummaryWriter serialized its data. If this logdir directory contains subdirectories which contain serialized data from separate runs, then TensorBoard will visualize the data from all of those runs. Once TensorBoard is running, navigate your web browser to localhost:6006 to view the TensorBoard.
If you have pip installed TensorBoard, you can use the simpler command
tensorboard --logdir=/path/to/log-directoryWhen looking at TensorBoard, you will see the navigation tabs in the top right corner. Each tab represents a set of serialized data that can be visualized. For any tab you are looking at, if the logs being looked at by TensorBoard do not contain any data relevant to that tab, a message will be displayed indicating how to serialize data that is applicable to that tab.
For in depth information on how to use the graph tab to visualize your graph, see TensorBoard: Visualizing your graph.

