所选示例 - 我们最喜欢的秘籍
这里是一个简短的教程,示例和代码片段的集合,展示了一些有用的经验和技巧,来制作更精美的图像,并克服一些 matplotlib 的缺陷。
共享轴限制和视图
通常用于使两个或更多绘图共享一个轴,例如,两个子绘图具有时间作为公共轴。 当你平移和缩放一个绘图,你想让另一个绘图一起移动。 为了方便这一点,matplotlib 轴支持sharex和sharey属性。 创建subplot()或axes()实例时,你可以传入一个关键字,表明要共享的轴。
In [96]: t = np.arange(0, 10, 0.01)In [97]: ax1 = plt.subplot(211)In [98]: ax1.plot(t, np.sin(2*np.pi*t))Out[98]: [<matplotlib.lines.Line2D object at 0x98719ec>]In [99]: ax2 = plt.subplot(212, sharex=ax1)In [100]: ax2.plot(t, np.sin(4*np.pi*t))Out[100]: [<matplotlib.lines.Line2D object at 0xb7d8fec>]
轻松创建子图
在 matplotlib 的早期版本中,如果你想使用 pythonic API 并创建一个figure实例,并从中创建一个subplots网格,而且可能带有共享轴,它涉及大量的样板代码。 例如:
# old stylefig = plt.figure()ax1 = fig.add_subplot(221)ax2 = fig.add_subplot(222, sharex=ax1, sharey=ax1)ax3 = fig.add_subplot(223, sharex=ax1, sharey=ax1)ax3 = fig.add_subplot(224, sharex=ax1, sharey=ax1)
Fernando Perez 提供了一个很好的顶级方法,来一次性创建subplots()(注意末尾的s),并为所有子图开启x和y共享。 你可以单独解构来获取轴域:
# new style method 1; unpack the axesfig, ((ax1, ax2), (ax3, ax4)) = plt.subplots(2, 2, sharex=True, sharey=True)ax1.plot(x)
或将它们作为行数乘列数的对象数组返回,支持 numpy 索引:
# new style method 2; use an axes arrayfig, axs = plt.subplots(2, 2, sharex=True, sharey=True)axs[0,0].plot(x)
修复常见的日期问题
matplotlib 允许你本地绘制 python datetime 实例,并且在大多数情况下,可以很好地挑选刻度位置和字符串格式。 但有几件事情它不能妥善处理,这里有一些技巧,用于帮助你解决他们。 我们将在numpy记录数组中加载一些包含datetime.date对象的示例日期数据:
In [63]: datafile = cbook.get_sample_data('goog.npy')In [64]: r = np.load(datafile).view(np.recarray)In [65]: r.dtypeOut[65]: dtype([('date', '|O4'), ('', '|V4'), ('open', '<f8'),('high', '<f8'), ('low', '<f8'), ('close', '<f8'),('volume', '<i8'), ('adj_close', '<f8')])In [66]: r.dateOut[66]:array([2004-08-19, 2004-08-20, 2004-08-23, ..., 2008-10-10, 2008-10-13,2008-10-14], dtype=object)
字段日期的numpy记录数组的dtype是| O4,这意味着它是一个 4 字节的 python 对象指针; 在这种情况下,对象是datetime.date实例,当我们在 ipython 终端窗口中打印一些样本时,我们可以看到。
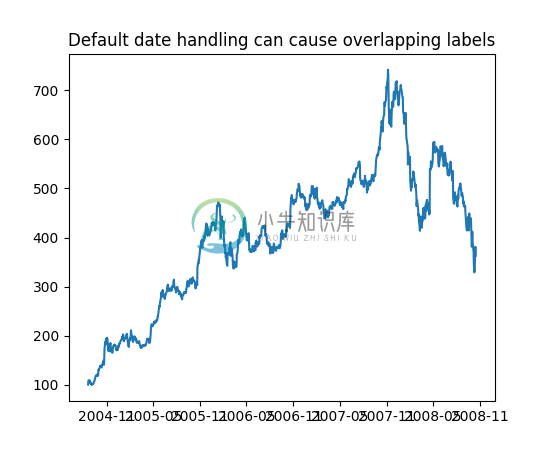
如果你绘制数据,
In [67]: plot(r.date, r.close)Out[67]: [<matplotlib.lines.Line2D object at 0x92a6b6c>]
你会看到 x 轴标签重合到一起。
另一个麻烦是,如果你将鼠标悬停在窗口上,并在 x 和 y 坐标处查看 matplotlib 工具栏(交互式导航)的右下角,你会看到 x 位置的格式与刻度标签的格式相同, 例如,『Dec 2004』。 我们想要的是工具栏中的位置具有更高的精确度,例如,鼠标悬停在上面时给我们确切的日期。 为了解决第一个问题,我们可以使用matplotlib.figure.Figure.autofmt_xdate()。修复第二个问题,我们可以使用ax.fmt_xdata属性,该属性可以设置为任何接受标量并返回字符串的函数。 matplotlib 有一些内置的日期格式化器,所以我们将使用其中的一个。
plt.close('all')fig, ax = plt.subplots(1)ax.plot(r.date, r.close)# rotate and align the tick labels so they look betterfig.autofmt_xdate()# use a more precise date string for the x axis locations in the# toolbarimport matplotlib.dates as mdatesax.fmt_xdata = mdates.DateFormatter('%Y-%m-%d')plt.title('fig.autofmt_xdate fixes the labels')
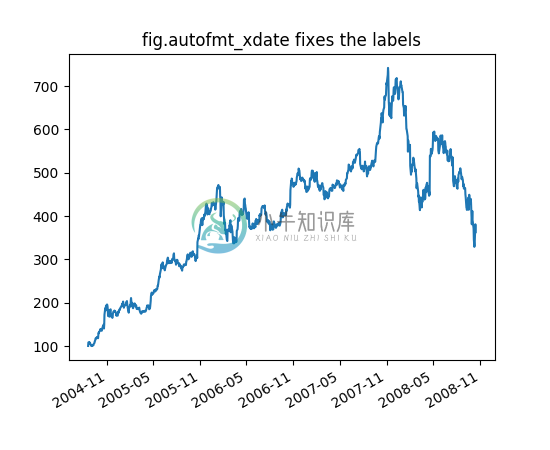
现在,当你将鼠标悬停在绘制的数据上,你将在工具栏中看到如2004-12-01的日期格式字符串。
透明度填充
fill_between()函数在最小和最大边界之间生成阴影区域,用于展示范围。 它有一个非常方便的参数,将填充范围与逻辑范围组合,例如,以便仅填充超过某个阈值的曲线。=
基本上,fill_between可以用来增强图形的视觉外观。 让我们比较两个财务-时间图表,左边是一个简单的线框图,右边是一个填充图。
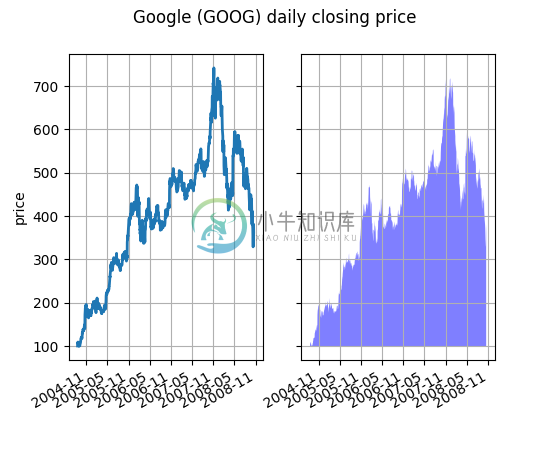
Alpha 通道在这里不是必需的,但它可以用来软化颜色,创建更具视觉吸引力的绘图。 在其他示例中,我们将在下面看到,Alpha 通道在功能上有用,因为阴影区域可以重叠,Alpha 允许你同时看到两者。 注意,postscript 格式不支持 alpha(这是一个 postscript 限制,而不是一个 matplotlib 限制),因此,当使用 alpha 时,将你的数字保存在 PNG,PDF 或 SVG 中。
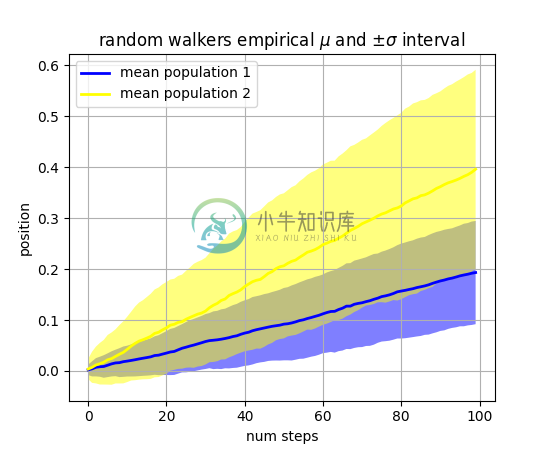
我们的下一个例子是计算随机漫步的两个群体,它们具有不同的正态分布平均值和标准差,足迹会从中绘制。我们使用共享区域来绘制群体的平均位置的加/减一个标准差。 这里的 Alpha 通道是有用的,不只是为了审美。
import matplotlib.pyplot as pltimport numpy as npNsteps, Nwalkers = 100, 250t = np.arange(Nsteps)# an (Nsteps x Nwalkers) array of random walk stepsS1 = 0.002 + 0.01*np.random.randn(Nsteps, Nwalkers)S2 = 0.004 + 0.02*np.random.randn(Nsteps, Nwalkers)# an (Nsteps x Nwalkers) array of random walker positionsX1 = S1.cumsum(axis=0)X2 = S2.cumsum(axis=0)# Nsteps length arrays empirical means and standard deviations of both# populations over timemu1 = X1.mean(axis=1)sigma1 = X1.std(axis=1)mu2 = X2.mean(axis=1)sigma2 = X2.std(axis=1)# plot it!fig, ax = plt.subplots(1)ax.plot(t, mu1, lw=2, label='mean population 1', color='blue')ax.plot(t, mu2, lw=2, label='mean population 2', color='yellow')ax.fill_between(t, mu1+sigma1, mu1-sigma1, facecolor='blue', alpha=0.5)ax.fill_between(t, mu2+sigma2, mu2-sigma2, facecolor='yellow', alpha=0.5)ax.set_title('random walkers empirical $mu$ and $pm sigma$ interval')ax.legend(loc='upper left')ax.set_xlabel('num steps')ax.set_ylabel('position')ax.grid()
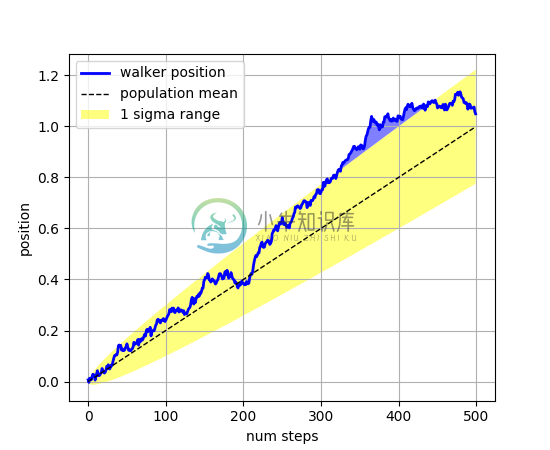
where关键字参数非常方便地用于突出显示图形的某些区域。 其中使用与x,ymin和ymax参数相同长度的布尔掩码,并且只填充布尔掩码为True的区域。 在下面的例子中,我们模拟一个随机漫步者,并计算人口位置的分析平均值和标准差。 群体平均值显示为黑色虚线,并且平均值的加/减一个标准差显示为黄色填充区域。 我们使用where=X>upper_bound找到漫步者在一个标准差边界之上的区域,并将该区域变成蓝色。
透明、花式图例
有时你在绘制数据之前就知道你的数据是什么样的,并且可能知道例如右上角没有太多数据。 然后,你可以安全地创建不覆盖你的数据的图例:
ax.legend(loc='upper right')
其他时候你不知道你的数据在哪里,而loc ='best'将尝试和放置图例:
ax.legend(loc='best')
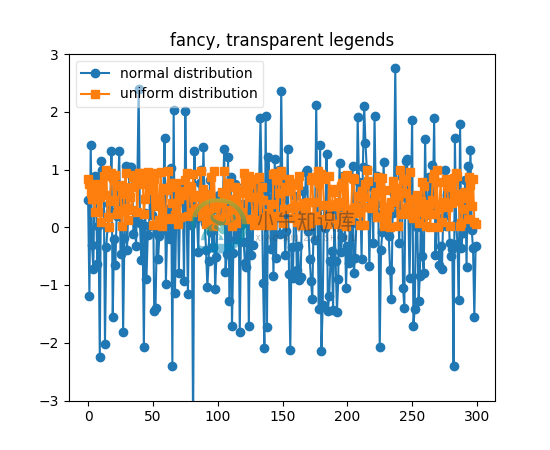
但仍然,你的图例可能会覆盖你的数据,在这些情况下,使图例框架透明非常不错。
np.random.seed(1234)fig, ax = plt.subplots(1)ax.plot(np.random.randn(300), 'o-', label='normal distribution')ax.plot(np.random.rand(300), 's-', label='uniform distribution')ax.set_ylim(-3, 3)ax.legend(loc='best', fancybox=True, framealpha=0.5)ax.set_title('fancy, transparent legends')
放置文本框
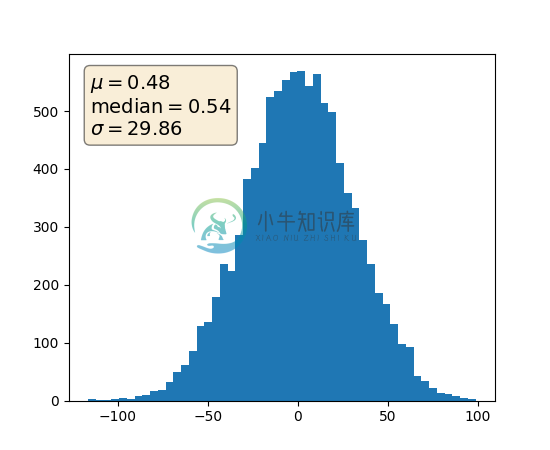
当使用文本框装饰轴时,两个有用的技巧是将文本放置在轴域坐标中(请参见变换教程),因此文本不会随着 x 或 y 轴的变化而移动。 你还可以使用文本的bbox属性,用Patch实例包围文本 - bbox关键字参数接受字典,字典的键是补丁的属性。
np.random.seed(1234)fig, ax = plt.subplots(1)x = 30*np.random.randn(10000)mu = x.mean()median = np.median(x)sigma = x.std()textstr = '$mu=%.2f$n$mathrm{median}=%.2f$n$sigma=%.2f$'%(mu, median, sigma)ax.hist(x, 50)# these are matplotlib.patch.Patch propertiesprops = dict(boxstyle='round', facecolor='wheat', alpha=0.5)# place a text box in upper left in axes coordsax.text(0.05, 0.95, textstr, transform=ax.transAxes, fontsize=14,verticalalignment='top', bbox=props)
