前端 - 组合图中滚动条如何设置?
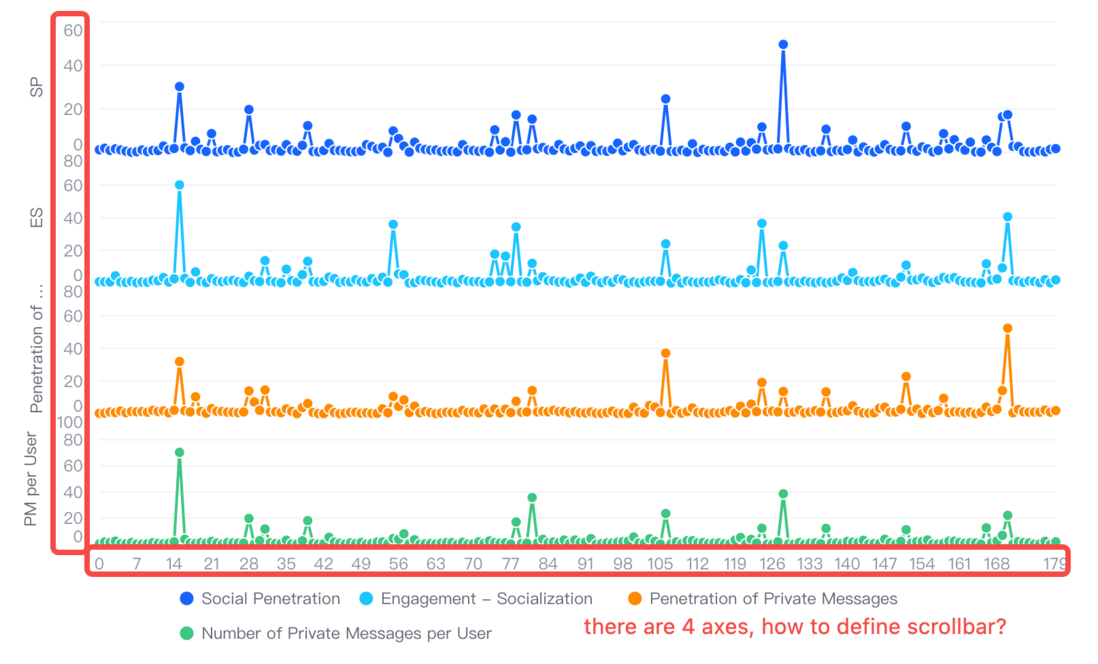
类似这样的组合图,通常有多个轴或多个数据区域,我应该如何配置滚动条从而使其控制指定区域的滚动?
共有1个答案
解决方案 Solution
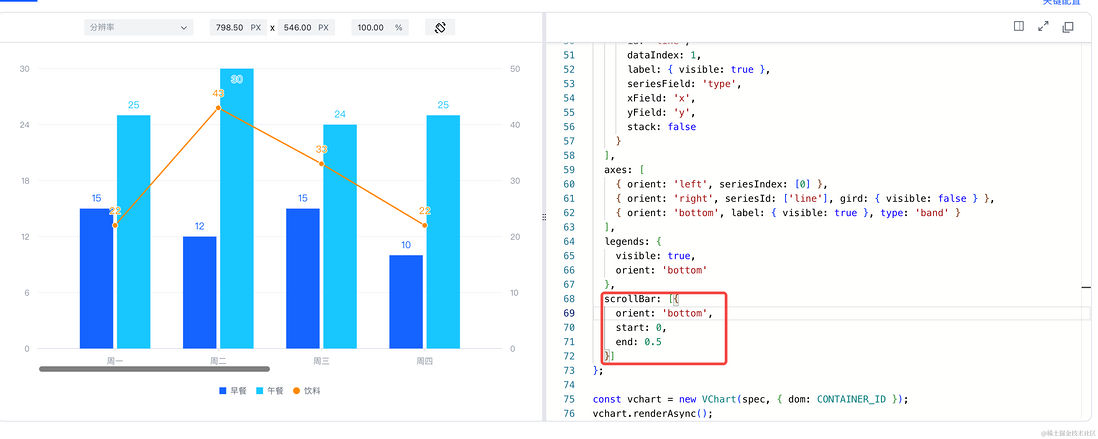
对于简单的组合图而言,您可以像普通图表一样声明滚动条,只需声明表示位置的属性scrollBar.orient和表示视口范围的属性scrollBar.start和scrollBar.end即可,如下图所示:

而对于复杂图表而言,您需要两个配置步骤:
- 为滚动条绑定坐标轴:
通过scrollBar.axisIndex或scrollBar.axisId将滚动条与坐标轴进行关联,方可基于坐标轴进行数据筛选或图元范围滚动操作。
- 为滚动条声明布局位置:
您图中涉及的图表是基于grid布局绘制的,所以需要定义滚动条的布局位置。
- 首先,需要在
grid.row的行数声明中添加一行用于放置横向滚动。 - 其次,需要在
grid.elements中声明滚动条的布局信息
{ modelId: 'scrollBar', // id col: 0, // col index row: 6 // row index },- 最后,需要将
scrollBar.id与grid.elements中的modelId对应起来。 - Finally, you need to match
scrollBar.idwith themodelIdingrid.elements.
代码示例 Code Example
const leftAxesCommonSpec = { expand: { max: 0.2 }, label: { flush: true, visible: true }, tick: { visible: false }, forceTickCount: 3};const spec = { type: "common", layout: { type: "grid", col: 2, row: 7, elements: [ { modelId: "legend", col: 0, colSpan: 2, row: 6 }, { modelId: "scrollBar", col: 0, colSpan: 2, row: 5 }, { modelId: "Social Penetration", col: 1, row: 0 }, { modelId: "Engagement - Socialization", col: 1, row: 1 }, { modelId: "Penetration of Private Messages", col: 1, row: 2 }, { modelId: "Number of Private Messages per User", col: 1, row: 3 }, { modelId: "Social Penetrationleft", col: 0, row: 0 }, { modelId: "Engagement - Socialization-left", col: 0, row: 1 }, { modelId: "Penetration of Private Messagesleft", col: 0, row: 2 }, { modelId: "Number of Private Messages per Userleft", col: 0, row: 3 }, { modelId: "Number of Private Messages per User-bottom", col: 1, row: 4 } ] }, region: [ { id: "Social Penetration" }, { id: "Engagement - Socialization" }, { id: "Penetration of Private Messages" }, { id: "Number of Private Messages per User" } ], scrollBar: [ { orient: "bottom", axisIndex: 4, id: "scrollBar", start: 0, end: 0.4, filterMode: "axis" } ], legends: { padding: { top: 10 }, visible: true, orient: "bottom", id: "legend", regionId: [ "Social Penetration", "Engagement - Socialization", "Penetration of Private Messages", "Number of Private Messages per User" ] }, seriesField: "type", tooltip: { dimension: { title: { value: (datum) => { return `第 ${datum.x} 天`; } }, content: [ { key: (datum) => datum.type, value: (datum) => datum.y } ] } }, series: [ { id: "Social Penetrationseries0", regionId: "Social Penetration", type: "line", data: { id: "Social Penetration" }, xField: "x", yField: "y" }, { id: "Engagement - Socialization-series0", regionId: "Engagement - Socialization", type: "line", data: { id: "Engagement - Socialization" }, xField: "x", yField: "y" }, { id: "Penetration of Private Messagesseries0", regionId: "Penetration of Private Messages", type: "line", data: { id: "Penetration of Private Messages" }, xField: "x", yField: "y" }, { id: "Number of Private Messages per Userseries0", regionId: "Number of Private Messages per User", type: "line", data: { id: "Number of Private Messages per User" }, xField: "x", yField: "y" } ], axes: [ { id: "Social Penetrationleft", regionId: "Social Penetration", orient: "left", title: { visible: true, text: "SP" }, ...leftAxesCommonSpec }, { id: "Engagement - Socialization-left", regionId: "Engagement - Socialization", orient: "left", title: { visible: true, text: "ES" }, ...leftAxesCommonSpec }, { id: "Penetration of Private Messagesleft", regionId: "Penetration of Private Messages", orient: "left", title: { visible: true, text: "Penetration of PM" }, ...leftAxesCommonSpec }, { id: "Number of Private Messages per Userleft", regionId: "Number of Private Messages per User", orient: "left", title: { visible: true, text: "PM per User" }, ...leftAxesCommonSpec }, { id: "Number of Private Messages per User-bottom", regionId: [ "Social Penetration", "Engagement - Socialization", "Penetration of Private Messages", "Number of Private Messages per User" ], orient: "bottom", label: { firstVisible: true, lastVisible: true, visible: true }, tick: { visible: false }, paddingInner: 0.99, paddingOuter: 0 } ]};const dataJson = { "Social Penetration": [ { x: 0, y: 1.2020804451630671, originXData: "2022-03-08", type: "Social Penetration" }, { x: 1, y: 1.911162758594358, originXData: "2022-03-09", type: "Social Penetration" }, // ... ], "Engagement - Socialization": [ { x: 0, y: 0.7782279444864411, originXData: "2022-03-08", type: "Engagement - Socialization \n\n" }, { x: 1, y: 0.6970763116149991, originXData: "2022-03-09", type: "Engagement - Socialization \n\n" }, // ... ], "Penetration of Private Messages": [ { x: 0, y: 0.21493020207806002, originXData: "2022-03-08", type: "Penetration of Private Messages" }, { x: 1, y: 0.31807068769079905, originXData: "2022-03-09", type: "Penetration of Private Messages" }, // ... ]};spec.series.forEach((s) => { s.data.values = dataJson[s.data.id];});结果展示 Results
在线效果参考:https://codesandbox.io/s/common-chart-with-scrollbar-n5t8ps
相关文档 Related Documentation
ScrollBar demo:https://www.visactor.io/vchart/demo/scrollbar/basic-scrollbar-bar-chart
滚动条教程:https://www.visactor.io/vchart/guide/tutorial_docs/Chart_Concepts/Scrollbar
相关api:https://www.visactor.io/vchart/option/commonChart#scrollbar
github:https://github.com/VisActor/VChart
-
当我需要配置滚动条默认滚动的位置的时候我该怎么做?有时我希望滚动条的起点和终点是我所指定的,而并非一个默认范围。
-
在飞书小程序中使用VChart时,柱图数据过多时,如何配置横向滚动条?
-
本文向大家介绍如何在JavaFX中向图像添加滚动条?,包括了如何在JavaFX中向图像添加滚动条?的使用技巧和注意事项,需要的朋友参考一下 滚动条包含附加到可滚动窗格的拇指,左右按钮。使用此功能,您可以上下滚动窗格(附加到窗格)。 在JavaFX中,javafx.scene.control.ScrollBar表示滚动条。您可以创建一个实例化此类的滚动条。通常,滚动条与其他控件关联,例如Scroll
-
我有一个元素,它本身有一个滚动条,还有一个单独的,它有一个滚动条。如何使其中一个滚动条与另一个滚动条的位置匹配? 我一直在查找获取滚动条位置的方法。 因为它们都返回不同的值,所以我必须知道它们的最大位置。
-
问题内容: 我正在尝试自动执行水平栏的滚动,其中水平栏的元素是动态的,并且可以从API中获取。 有没有一种方法可以在appium中使其自动化? 问题答案: 如果页面底部有任何元素或文本,则可以使用UiAutomator2。 如果您使用的是appium,请添加所需的功能’UiAutomator2’。 现在,如果您有元素的ID,请使用以下函数 如果您有元素的文本,请使用它。 如果您不知道botton中
-
现在挡到了文字,能不能把滚动条挪到更右边,不设置元素的padding-right

