前端 - 怎么提高页面中大量图表渲染的性能?
我的使用场景是需要批量绘制大量图表,不过这些图表具有一定的规律性,整行或者整列是同类型图表,有什么方式可以优化性能呢?现在问题是当滚动的时候,图表渲染跟不上,滚动交互也不流畅。
共有2个答案
解决方案 Solution
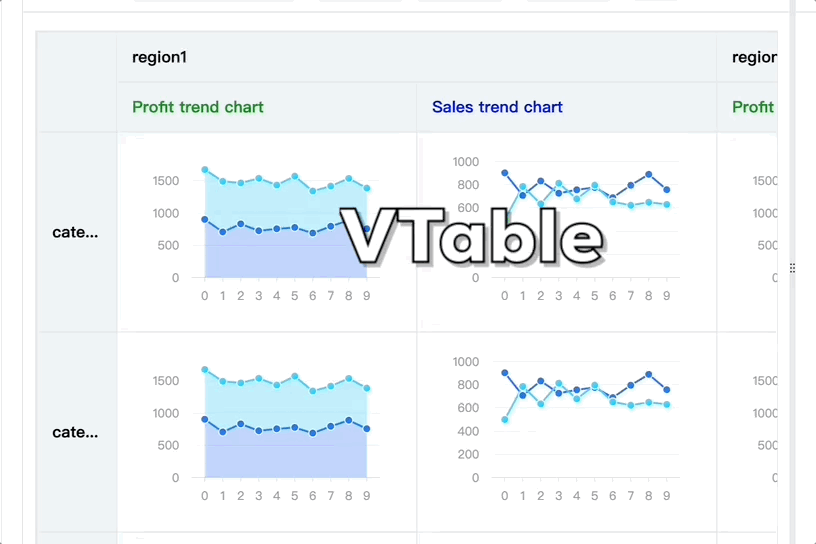
根据你的使用场景,我推荐使用表格和图表结合的方式来渲染大量图表,这个VTable组件已经可以做到,使用时注册他们的VChart来绘制单元格内图表,内部可能做了渲染优化,滚动起来非常流畅!

代码示例 Code Example
代码参考 Code Example
import * as VTable from "@visactor/vtable";import VChart from '@visactor/vchart';VTable.register.chartModule('vchart', VChart); const records = []; for (let i = 1; i <= 10; i++) { for (let j = 1; j <= 10; j++) { const record = { region: 'region' + i, }; record['category'] = 'category' + j; record.areaChart = [ { x: '0', type: 'A', y: 900 + i + j }, { x: '1', type: 'A', y: '707' }, { x: '2', type: 'A', y: '832' }, { x: '3', type: 'A', y: '726' }, { x: '4', type: 'A', y: '756' }, { x: '5', type: 'A', y: '777' }, { x: '6', type: 'A', y: '689' }, { x: '7', type: 'A', y: '795' }, { x: '8', type: 'A', y: '889' }, { x: '9', type: 'A', y: '757' }, { x: '0', type: 'B', y: '773' }, { x: '1', type: 'B', y: '785' }, { x: '2', type: 'B', y: '635' }, { x: '3', type: 'B', y: '813' }, { x: '4', type: 'B', y: '678' }, { x: '5', type: 'B', y: '796' }, { x: '6', type: 'B', y: '652' }, { x: '7', type: 'B', y: '623' }, { x: '8', type: 'B', y: '649' }, { x: '9', type: 'B', y: '630' }, ]; record.lineChart = [ { x: '0', type: 'A', y: 900 + i + j }, { x: '1', type: 'A', y: '707' }, { x: '2', type: 'A', y: '832' }, { x: '3', type: 'A', y: '726' }, { x: '4', type: 'A', y: '756' }, { x: '5', type: 'A', y: '777' }, { x: '6', type: 'A', y: '689' }, { x: '7', type: 'A', y: '795' }, { x: '8', type: 'A', y: '889' }, { x: '9', type: 'A', y: '757' }, { x: '0', type: 'B', y: 500 }, { x: '1', type: 'B', y: '785' }, { x: '2', type: 'B', y: '635' }, { x: '3', type: 'B', y: '813' }, { x: '4', type: 'B', y: '678' }, { x: '5', type: 'B', y: '796' }, { x: '6', type: 'B', y: '652' }, { x: '7', type: 'B', y: '623' }, { x: '8', type: 'B', y: '649' }, { x: '9', type: 'B', y: '630' }, ]; records.push(record); } }const option = { records, defaultRowHeight:200, defaultHeaderRowHeight:50, indicators: [ { indicatorKey: 'lineChart', title: 'Sales trend chart', headerStyle: { color: 'blue', // bgColor: 'yellow', }, cellType: 'chart', chartModule: 'vchart', width: 300, chartSpec: { type: 'common', series: [ { type: 'line', data: { id: 'data', }, xField: 'x', yField: 'y', seriesField: 'type', }, ], axes: [ { orient: 'left', range: { min: 0 } }, { orient: 'bottom', label: { visible: true }, type: 'band' }, ], }, }, { indicatorKey: 'areaChart', title: 'Profit trend chart', headerStyle: { color: 'green', }, cellType: 'chart', chartModule: 'vchart', width: 300, chartSpec: { type: 'common', series: [ { type: 'area', data: { id: 'data', }, xField: 'x', yField: 'y', seriesField: 'type', point: { style: { fillOpacity: 1, strokeWidth: 0, }, state: { hover: { fillOpacity: 0.5, stroke: 'blue', strokeWidth: 2, }, selected: { fill: 'red', }, }, }, area: { style: { fillOpacity: 0.3, stroke: '#000', strokeWidth: 4, }, state: { hover: { fillOpacity: 1, }, selected: { fill: 'red', fillOpacity: 1, }, }, }, }, ], axes: [ { orient: 'left', range: { min: 0 } }, { orient: 'bottom', label: { visible: true }, type: 'band' }, ], }, }, ], columnTree: [ { dimensionKey: 'region', value: 'region1', children: [ { indicatorKey: 'areaChart', }, { indicatorKey: 'lineChart', }, ], }, { dimensionKey: 'region', value: 'region2', children: [ { indicatorKey: 'areaChart', }, { indicatorKey: 'lineChart', }, ], }, { dimensionKey: 'region', value: 'region3', children: [ { indicatorKey: 'areaChart', }, { indicatorKey: 'lineChart', }, ], }, ], rowTree: [ { dimensionKey: 'category', value: 'category1', }, { dimensionKey: 'category', value: 'category2', }, { dimensionKey: 'category', value: 'category3', }, { dimensionKey: 'category', value: 'category4', }, { dimensionKey: 'category', value: 'category1', }, { dimensionKey: 'category', value: 'category2', }, { dimensionKey: 'category', value: 'category3', }, { dimensionKey: 'category', value: 'category4', }, { dimensionKey: 'category', value: 'category1', }, { dimensionKey: 'category', value: 'category2', }, { dimensionKey: 'category', value: 'category3', }, { dimensionKey: 'category', value: 'category4', }, { dimensionKey: 'category', value: 'category1', }, { dimensionKey: 'category', value: 'category2', }, { dimensionKey: 'category', value: 'category3', }, { dimensionKey: 'category', value: 'category4', }, ], corner: { titleOnDimension: 'row', }, dragHeaderMode: 'all'};const tableInstance = new VTable.PivotTable(document.getElementById(CONTAINER_ID),option);结果展示 Results
在线效果参考:https://visactor.io/vtable/demo/cell-type/chart

相关文档 Related Documentation
表格集成图表教程:https://visactor.io/vtable/guide/cell_type/chart
相关api:https://visactor.io/vtable/option/ListTable-columns-chart#cel...
github:https://github.com/VisActor/VTable
找 UI 改设计,
或者找需求给甲方升级电脑,
人力不敌天数 ...
类似的图为啥不能按 Tab 页走?
非要凑在一起?
一堆图标谁看着不眼花?
那么多数据谁看的过来?
我这边做的项目最多就 3 个 ECHART,
还是那种上大屏幕的项目 ...
-
本文向大家介绍react怎么提高列表渲染的性能?相关面试题,主要包含被问及react怎么提高列表渲染的性能?时的应答技巧和注意事项,需要的朋友参考一下 使用webpack 做代码分割。 使用hooks。
-
抓取前端渲染的页面 随着AJAX技术不断的普及,以及现在AngularJS这种Single-page application框架的出现,现在js渲染出的页面越来越多。对于爬虫来说,这种页面是比较讨厌的:仅仅提取HTML内容,往往无法拿到有效的信息。那么如何处理这种页面呢?总的来说有两种做法: 在抓取阶段,在爬虫中内置一个浏览器内核,执行js渲染页面后,再抓取。这方面对应的工具有Selenium、H
-
就是通过F12开发者工具在网页中检查网络的那个图
-
web-frame 模块可自定义渲染当前网页 进程: 渲染进程 例如放大当前页至 200%. 1 const {webFrame} = require('electron') 2 webFrame.setZoomFactor(2) Copied! 方法 webFrame.setZoomFactor(factor) 用途:设置页面的缩放系数 factor Number - 缩放系数 注意:缩放系数
-
目前使用 markdown 编辑的文章通过 next.js 在构建时进行了预渲染,生成了 html 文件,如果要让小程序也能读取文章,只能先获取 markdown 内容,然后转化为 wxml,但是小程序不支持动态添加 wxml,这个应该怎么渲染?
-
渲染出来的标签 怎么添加@click 我在红框里直接添加点击事件报错

