问题:

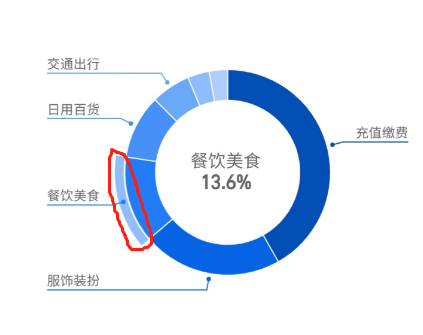
前端 - echarts这个效果怎么做的?
微生昌胤
 点击圆环的哪里,哪里外面就会出现一条弧线。
共有2个答案
钱繁
<canvas id="canvas"></canvas>
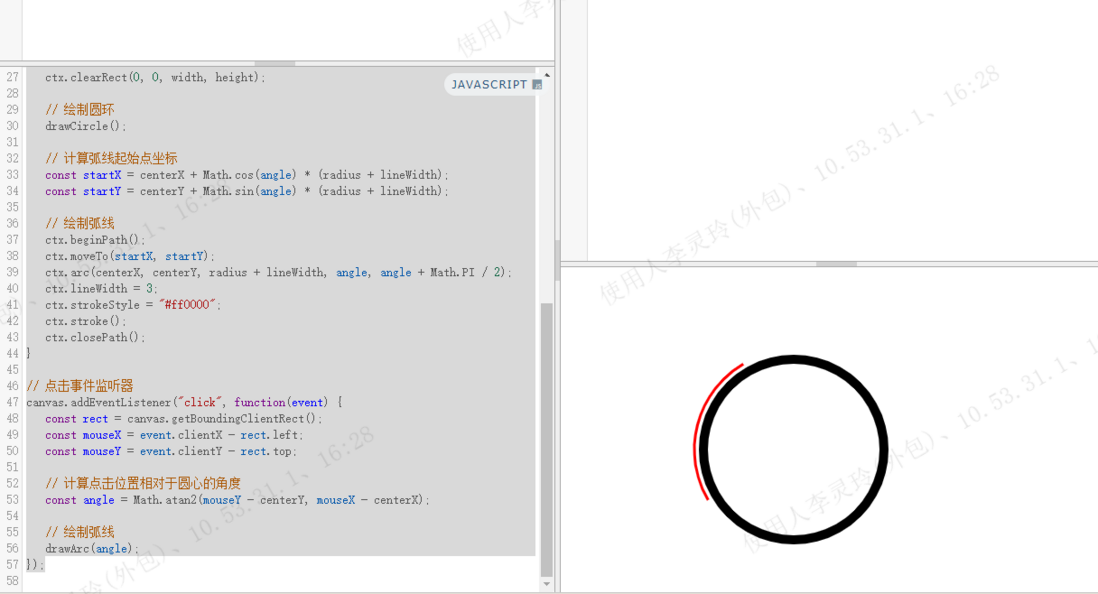
const canvas = document.getElementById("canvas");const ctx = canvas.getContext("2d");const width = 500; // 画布宽度const height = 500; // 画布高度canvas.width = width;canvas.height = height;const centerX = width / 2; // 圆心 x 坐标const centerY = height / 2; // 圆心 y 坐标const radius = 100; // 圆环半径const lineWidth = 10; // 圆环线条宽度// 绘制圆环function drawCircle() { ctx.beginPath(); ctx.arc(centerX, centerY, radius, 0, Math.PI * 2); ctx.lineWidth = lineWidth; ctx.strokeStyle = "#000000"; ctx.stroke(); ctx.closePath();}// 绘制弧线function drawArc(angle) { ctx.clearRect(0, 0, width, height); // 绘制圆环 drawCircle(); // 计算弧线起始点坐标 const startX = centerX + Math.cos(angle) * (radius + lineWidth); const startY = centerY + Math.sin(angle) * (radius + lineWidth); // 绘制弧线 ctx.beginPath(); ctx.moveTo(startX, startY); ctx.arc(centerX, centerY, radius + lineWidth, angle, angle + Math.PI / 2); ctx.lineWidth = 3; ctx.strokeStyle = "#ff0000"; ctx.stroke(); ctx.closePath();}// 点击事件监听器canvas.addEventListener("click", function(event) { const rect = canvas.getBoundingClientRect(); const mouseX = event.clientX - rect.left; const mouseY = event.clientY - rect.top; // 计算点击位置相对于圆心的角度 const angle = Math.atan2(mouseY - centerY, mouseX - centerX); // 绘制弧线 drawArc(angle);});
以上来着AI答案,亲测了效果请看图片,再加点动画效果和点击那个区域展示大小限制应该就差不多就能实现了,可以参考一下哈。个人感觉css也能实现回头研究一下可以。
邹嘉荣
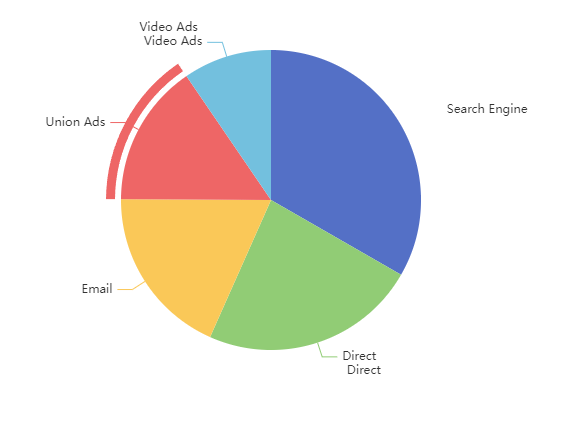
说下 echarts 实现这个效果的思路
- 叠加一层
pie做一个圆环,和内层使用相同的数据 - 通过事件动态添加,只显示当前点击区块的外层环,其他全部透明即可
const chartDom = document.getElementById('main');const myChart = echarts.init(chartDom);function getDefaultOptions() { return { name: 'Access From', type: 'pie', radius: '50%', data: [ { value: 1048, name: 'Search Engine' }, { value: 735, name: 'Direct' }, { value: 580, name: 'Email' }, { value: 484, name: 'Union Ads' }, { value: 300, name: 'Video Ads' } ] }}function getWrapperPie(name) { return { name: 'Access From', type: 'pie', radius: ['52%', '55%'], data: getDefaultOptions().data.map((item) => { if (item.name !== name) { item.itemStyle = { color: 'transparent' } } return item; }) }}myChart.setOption({ series: [ getDefaultOptions() ]});myChart.on('click', 'series.pie', (params) => { const { name } = params.data; const options = { series: [ getDefaultOptions(), getWrapperPie(name) ] } myChart.setOption(options);})
类似资料:
-
在 www.isqqw.com 这个网站中找的,突然被删了
-
用Echarts GL怎么实现这种效果 有没有类似例子的配置代码参考
-
element-plus 的这个无限滚动 怎么没有效果? https://element-plus.org/zh-CN/component/infinite-scroll.html 比如这个问题:demo
-
,文字前面跟着已到期或者即将到期,但是这段文字是右对齐,且以最长文本的长度作为整个盒子的宽度,并设置背景色。
-
我想做一个跟https://geojson.io/一样的可交互的地球,而且还不卡,请问应该用什么方案实现?
-
这是两个可以高亮的柱状图,但是我希望只能高亮一个,点击其中一个高亮,另一个取消有什么方法吗 我之前想地啊你其中一个修改另一个样式,但是后面再次高亮会闪一下消失

