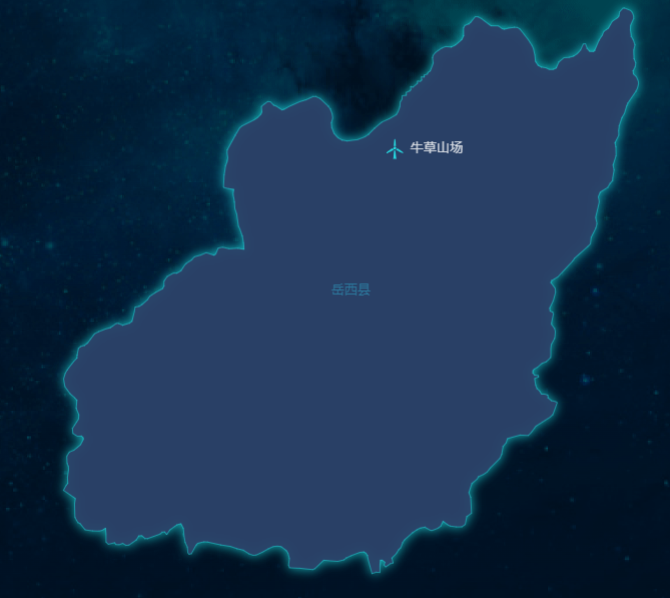
问题:

前端 - vue3下钻地图时通过调用父组件方法切换显示图标时报错,如何修改?
壤驷俊逸
地图组件:
// 此处是echart的option数据
const setOptions = computed(() => {
// ******************处理了从父组件传过来的地图图标数据***************
var geoCoordMapFD = props.xAxisData.geoCoordMapFd || []
var cityDataFD = props.xAxisData.cityDataFd || []

var geoCoordMapGF = props.xAxisData.geoCoordMapGf || []
var cityDataGF = props.xAxisData.cityDataGf || []

var convertDataFD = function (data) {}
var convertDataGF = function (data) {}

var iconFD = 'image://./images/ufd.svg'
var iconGF = 'image://./images/ugf.svg'
// ************************************
let option = {
    //    option数据
}
return option
})


// 创建图例方法
function initChart(datas, citys, mapName) {// datas 是地图数据,citys和mapName是地图城市名字
      nextTick(() => {
        echarts.init(document.getElementById(props.chartId)).dispose() // 销毁实例
        state.myChart = echarts.init(document.getElementById(props.chartId))
        window.addEventListener('resize', () => { // 重置尺寸
          state.myChart.resize()
        })
        // ******单击方法下钻地图数据******
        state.myChart.on('click', function (param) {
          if (param.region) {
            ctx.emit('changeMapHost', param.region.name) // ******此处调用父组件方法来修改地图上的图标数据******
            for (let i = 0; i < state.jsonAry.length; i++) {
              if (city[0].cityName === state.jsonAry[i].name.slice(0, state.jsonAry[i].name.length - 1)) {
                axios.get(state.jsonAry[i].url).then((res) => {
                  initChart(res.data, state.jsonAry[i].name, param.region.name)
                })
                break
              } else {
                console.log('数据匹配不上~')
              }
            }
          }
        })
        // ******双击返回大地图******
        state.myChart.on('dblclick', function (param) {
          if (param.region.name != citys) {
            ctx.emit('changeMapHost', citys) // ******此处调用父组件方法来修改地图上的图标数据******
            for (let i = 0; i < state.jsonAry.length; i++) {
              if (city[0].cityName === state.jsonAry[i].name.slice(0, state.jsonAry[i].name.length - 1)) {
                axios.get(state.jsonAry[i].url).then((res) => {
                  initChart(res.data, state.jsonAry[i].name, citys)
                })
                break
              } else {
                console.log('数据匹配不上~')
              }
            }
          }
        })
        // ******其他事件******
        state.cityList = {}
        let Cname = transform(mapName)
        state.cityName = Cname
        if (citys === mapName) {
          state.cityList = datas
          echarts.registerMap(state.cityName, state.cityList)
          state.myChart.clear()
          state.myChart.setOption(setOptions.value, false, true)
        } else {
          for (let i = 0; i < datas.features.length; i++) {
            if (mapName === datas.features[i].properties.name) {
              let aryList = {
                type: 'FeatureCollection',
                features: [datas.features[i]],
              }
              state.cityList = aryList
              echarts.registerMap(state.cityName, state.cityList)
              state.myChart.clear()
              state.myChart.setOption(setOptions.value, false, true)
              break
            }
          }
        }
      })
    }
// 监听传值,刷新图表
watch([() => props.seriesData, () => props.xAxisData, mapName], (newVal) => {
      initChart()
      return newVal
    })
父组件:
// 地图组件
<MapChart
  :xAxisData="mapAxisData"
  :seriesData="mapSeriesData"
  :mapName="systemArea"
  @changeMapHost="changeMapHost"
></MapChart>

const changeMapHost = async (value) => { // 地图上图标数据
      console.log(value)
      state.mapAxisData = {}
      state.mapSeriesData = {}
      const params = { areaName: value }
      await proxy.$request
        .get(`/reported/forecast/areaInfo`, {
          params,
        })
        .then((res) => {
          state.mapAxisData = res.data.plantInFo
          state.mapSeriesData = res.data.areaInfoList
        })
    }
 return {
      ...toRefs(state),
      changeMapHost,
    }
如果不使用 ctx.emit('changeMapHost', citys) 更新图标值,下钻和图标都可以正常显示,但下钻之后的图标数据是大地图的整体数据。
一旦去更新县、市级图标数据就会报错TypeError: Cannot read properties of undefined (reading 'svg') 或者 Error: Initialize failed: invalid dom. 
该怎么修改才能正常更新图标呢?
共有1个答案
唐默
watch(
  [() => props.seriesData, () => props.xAxisData, () => mapName],
  (newVal) => {
    // 传入地图数据,城市名字和地图名字
    initChart(props.xAxisData, citys, mapName.value);
    return newVal;
  }
);
类似资料:
-
问题内容: 我目前正在使用一个Web应用程序,该应用程序的页面显示一个图表(.png图像)。在页面的另一部分上,有一组链接,单击这些链接后,整个页面将重新加载,并且外观与之前完全相同,除了页面中间的图表。 我要做的是单击页面上的链接后,页面上的图表才更改。由于页面大约100kb大,这将极大地加快处理速度,并且真的不想为了显示此页面而重新加载整个页面。 我一直在通过JavaScript执行此操作,到
-
需求是这样的 已选中的数据现在放一个数组里,数组里的时间也转换成了字符串,但是报这个错
-
我正试图通过adb shell在我的三星Note 3上显示本地图像。 ,但仍然不起作用。有人能帮我吗,真的很感激!
-
求教: 有些公司在百度地图上可以看见(缩放等级百度地图50米) leaflet调取百度地图切片数据后反而看不见了是为什么呢
-
百度地图加载的时候 默认是第二张地球的 ,我缩放最小层级也是第二张图, 但是鼠标是可以滚动层级到第一张图的样式的, 如何设置初始化的是时候记载称第一张图呢 初始化的时候 地球默认层级是鼠标滚动的的最小层级样式

