
Python中是否已经实现了一些计算多类混淆矩阵的TP、TN、FP和FN的方法?

Sklearn.metrics具有获取分类指标的强大功能,尽管我认为缺少的是在给定预测和实际标签序列的情况下返回TP、FN、FP和FN计数的函数。甚至从混淆矩阵。
我知道可以使用skLearning获取混淆矩阵,但我需要实际的TP、FN、FP和FN计数(对于多标签分类-超过2个标签),并为每个类获取这些计数。
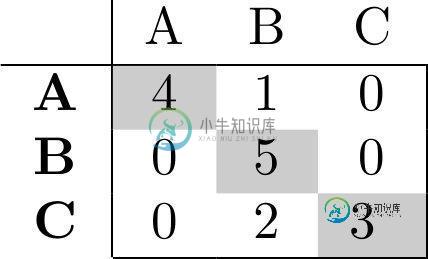
比如说,我有下面的混淆矩阵和3个类。是否有一些包可以从中获取每个类的计数?我什么也找不到。
共有2个答案

我最终自己实现了它,因为我没有找到任何东西。以下是代码,以防将来有人查找此代码:
def counts_from_confusion(confusion):
    """
    Obtain TP, FN FP, and TN for each class in the confusion matrix
    """

    counts_list = []

    # Iterate through classes and store the counts
    for i in range(confusion.shape[0]):
        tp = confusion[i, i]

        fn_mask = np.zeros(confusion.shape)
        fn_mask[i, :] = 1
        fn_mask[i, i] = 0
        fn = np.sum(np.multiply(confusion, fn_mask))

        fp_mask = np.zeros(confusion.shape)
        fp_mask[:, i] = 1
        fp_mask[i, i] = 0
        fp = np.sum(np.multiply(confusion, fp_mask))

        tn_mask = 1 - (fn_mask + fp_mask)
        tn_mask[i, i] = 0
        tn = np.sum(np.multiply(confusion, tn_mask))

        counts_list.append({'Class': i,
                            'TP': tp,
                            'FN': fn,
                            'FP': fp,
                            'TN': tn})

    return counts_list

Scikit learn可以计算和绘制多类混淆矩阵,请参见文档中的示例(Jupiter笔记本上的演示):
import itertools
import numpy as np
import matplotlib.pyplot as plt

from sklearn import svm, datasets
from sklearn.model_selection import train_test_split
from sklearn.metrics import confusion_matrix

# import some data to play with
iris = datasets.load_iris()
X = iris.data
y = iris.target
class_names = iris.target_names

# Split the data into a training set and a test set
X_train, X_test, y_train, y_test = train_test_split(X, y, random_state=0)

# Run classifier, using a model that is too regularized (C too low) to see
# the impact on the results
classifier = svm.SVC(kernel='linear', C=0.01)
y_pred = classifier.fit(X_train, y_train).predict(X_test)


def plot_confusion_matrix(cm, classes,
                          normalize=False,
                          title='Confusion matrix',
                          cmap=plt.cm.Blues):
    """
    This function prints and plots the confusion matrix.
    Normalization can be applied by setting `normalize=True`.
    """
    plt.imshow(cm, interpolation='nearest', cmap=cmap)
    plt.title(title)
    plt.colorbar()
    tick_marks = np.arange(len(classes))
    plt.xticks(tick_marks, classes, rotation=45)
    plt.yticks(tick_marks, classes)

    if normalize:
        cm = cm.astype('float') / cm.sum(axis=1)[:, np.newaxis]
        print("Normalized confusion matrix")
    else:
        print('Confusion matrix, without normalization')

    print(cm)

    thresh = cm.max() / 2.
    for i, j in itertools.product(range(cm.shape[0]), range(cm.shape[1])):
        plt.text(j, i, cm[i, j],
                 horizontalalignment="center",
                 color="white" if cm[i, j] > thresh else "black")

    plt.tight_layout()
    plt.ylabel('True label')
    plt.xlabel('Predicted label')

# Compute confusion matrix
cnf_matrix = confusion_matrix(y_test, y_pred)
np.set_printoptions(precision=2)

# Plot non-normalized confusion matrix
plt.figure()
plot_confusion_matrix(cnf_matrix, classes=class_names,
                      title='Confusion matrix, without normalization')

# Plot normalized confusion matrix
plt.figure()
plot_confusion_matrix(cnf_matrix, classes=class_names, normalize=True,
                      title='Normalized confusion matrix')

plt.show()
结果(txt):
Confusion matrix, without normalization
[[13  0  0]
 [ 0 10  6]
 [ 0  0  9]]

Normalized confusion matrix
[[ 1.    0.    0.  ]
 [ 0.    0.62  0.38]
 [ 0.    0.    1.  ]]
剧情结果:
请参阅下面链接上的这段代码:
JUPYTER NOTEBOOK上的DEMO
-
我有混乱矩阵如下: 现在如何从这个混淆矩阵中找到真正、真负、假正和假负值。Weka给我的TP利率和真正的正值一样吗?
-
我正在对实际数据和来自分类器的预测数据进行多标签分类。实际数据包括三类(c1、c2和c3),同样,预测数据也包括三类(c1、c2和c3)。数据如下 在多标签分类中,文档可能属于多个类别。在上述数据中,1表示文档属于特定类,0表示文档不属于特定类。 第一行Actual\u数据表示文档属于c1类和c2类,不属于c3类。类似地,第一行predicted\u数据表示文档属于类别c1、c2和c3。 最初我使
-
我正在使用分类器的多类多标签输出。类的总数为14,实例可以关联多个类。例如: 我现在制作混淆矩阵的方式: 输出如下: 现在,我不确定sklearn的混淆矩阵是否能够处理多标签多类数据。谁能帮我一下吗?
-
我试图弄清楚如何使用神经网络为多标签分类任务生成混淆矩阵。我之前设法使用函数“交集”计算准确性,因为对此我不关心任何排序。 然而,为了计算混淆矩阵,我确实关心预测/标签的索引顺序。由于标签的值始终相同(
-
假设我有一个具有n个级别的因子变量y,我有预测和实际结果。如何构造混淆矩阵? 对于n=2的情况,这个问题已经得到了回答。看见 R:如何为预测模型制作混淆矩阵? 我试过的 这就是我能走多远 现在这必须以矩阵的形式呈现。 出身背景 混淆矩阵具有水平标签“实际类别”和垂直标签“预测类别”。矩阵元素的计数如下所示: 元素(1,1)=实际类的计数数为A,预测类的计数数为A 元素(1,2)=实际类别为A,预测
-
目前我们衡量分类器准确率的方式是使用以下公式:正确分类的记录数÷记录总数。 有时我们会需要一个更为详细的评价结果,这时就会用到一个称为混淆矩阵的可视化表格。 表格的行表示测试用例实际所属的类别,列则表示分类器的判断结果。 混淆矩阵可以帮助我们快速识别出分类器到底在哪些类别上发生了混淆,因此得名。 让我们看看运动员的示例,这个数据集中有300人,使用十折交叉验证,其混淆矩阵如下: 可以看到,100个