
pyplot在图例中组合多个线标签

我有导致绘制多条线的数据,我想在图例中为这些线添加一个标签。我认为用下面的例子可以更好地说明这一点,
a = np.array([[ 3.57,  1.76,  7.42,  6.52],
              [ 1.57,  1.2 ,  3.02,  6.88],
              [ 2.23,  4.86,  5.12,  2.81],
              [ 4.48,  1.38,  2.14,  0.86],
              [ 6.68,  1.72,  8.56,  3.23]])

plt.plot(a[:,::2].T, a[:, 1::2].T, 'r', label='data_a')

plt.legend(loc='best')
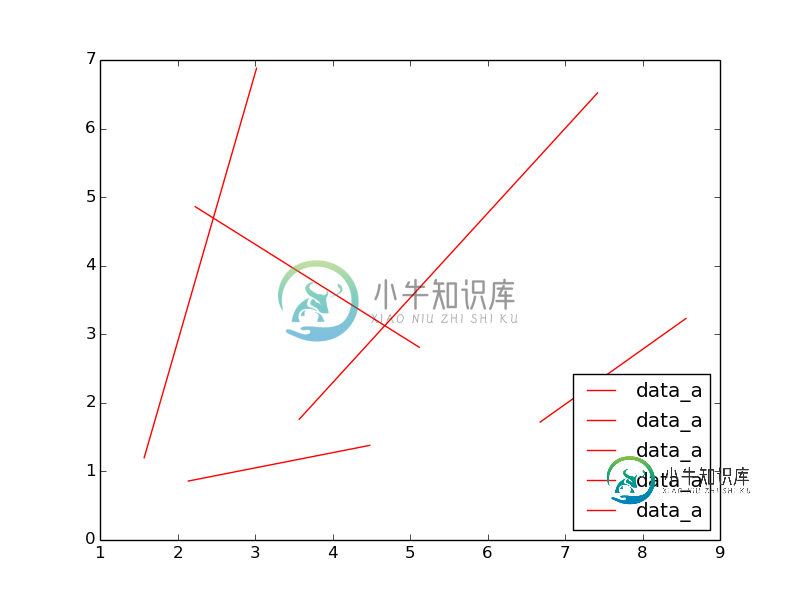
有没有办法告诉plot方法避免多个标签?我不想尽可能多地使用自定义图例(您可以同时指定标签和线型)。
共有3个答案

Matplotlib为您提供了一个很好的线集合界面,LineCollection。代码是直截了当的
import numpy
import matplotlib.pyplot as plt
from matplotlib.collections import LineCollection

a = numpy.array([[ 3.57,  1.76,  7.42,  6.52],
                 [ 1.57,  1.2 ,  3.02,  6.88],
                 [ 2.23,  4.86,  5.12,  2.81],
                 [ 4.48,  1.38,  2.14,  0.86],
                 [ 6.68,  1.72,  8.56,  3.23]])

xs = a[:,::2]
ys = a[:, 1::2]
lines = LineCollection([list(zip(x,y)) for x,y in zip(xs, ys)], label='data_a')
f, ax = plt.subplots(1, 1)
ax.add_collection(lines)
ax.legend()
ax.set_xlim([xs.min(), xs.max()]) # have to set manually
ax.set_ylim([ys.min(), ys.max()])
plt.show()

Numpy解决方案基于上面的意志的反应。
import numpy as np
import matplotlib.pylab as plt
a = np.array([[3.57, 1.76, 7.42, 6.52],
              [1.57, 1.20, 3.02, 6.88],
              [2.23, 4.86, 5.12, 2.81],
              [4.48, 1.38, 2.14, 0.86],
              [6.68, 1.72, 8.56, 3.23]])

plt.plot(a[:,::2].T, a[:, 1::2].T, 'r', label='data_a')
handles, labels = plt.gca().get_legend_handles_labels()
假设相等的标签具有相等的句柄,则获取唯一的标签及其各自的索引,它们对应于句柄索引。
labels, ids = np.unique(labels, return_index=True)
handles = [handles[i] for i in ids]
plt.legend(handles, labels, loc='best')
plt.show()

如果我打算经常做的话,我会亲自做一个小助手;
from matplotlib import pyplot
import numpy


a = numpy.array([[ 3.57,  1.76,  7.42,  6.52],
                 [ 1.57,  1.2 ,  3.02,  6.88],
                 [ 2.23,  4.86,  5.12,  2.81],
                 [ 4.48,  1.38,  2.14,  0.86],
                 [ 6.68,  1.72,  8.56,  3.23]])


def plotCollection(ax, xs, ys, *args, **kwargs):

  ax.plot(xs,ys, *args, **kwargs)

  if "label" in kwargs.keys():

    #remove duplicates
    handles, labels = pyplot.gca().get_legend_handles_labels()
    newLabels, newHandles = [], []
    for handle, label in zip(handles, labels):
      if label not in newLabels:
        newLabels.append(label)
        newHandles.append(handle)

    pyplot.legend(newHandles, newLabels)

ax = pyplot.subplot(1,1,1)
plotCollection(ax, a[:,::2].T, a[:, 1::2].T, 'r', label='data_a')
plotCollection(ax, a[:,1::2].T, a[:, ::2].T, 'b', label='data_b')
pyplot.show()
从图例的句柄和标签中删除重复项(比您现有的更简单)的方法是:
handles, labels = pyplot.gca().get_legend_handles_labels()
newLabels, newHandles = [], []
for handle, label in zip(handles, labels):
  if label not in newLabels:
    newLabels.append(label)
    newHandles.append(handle)
pyplot.legend(newHandles, newLabels)
-
我使用JSChart来创建一个简单的时间图。我没有在他们的文档中找到任何设置时间标签的信息。我只想每天出现一次。最好是在午夜。 现在我每个数据集得到1个日期标签。这太过分了。 示例图像 JS函数初始化图表 PHP调用上面的模板。
-
通过组合曲线CurvePath可以把多个圆弧线、样条曲线、直线等多个曲线合并成一个曲线。 U型案例 var geometry = new THREE.Geometry(); //声明一个几何体对象Geometry // 绘制一个U型轮廓 var R = 80;//圆弧半径 var arc = new THREE.ArcCurve(0, 0, R, 0, Math.PI, true); // 半圆弧
-
我是Apache GraphX的新手,我想看看是否可以在GraphX中进行图形合并/合并。我想做的是说我有下面的2个图
-
我想在pyqt GUI中为matplotlib(python)中的多个绘图创建一个自定义图例。(pyqt建议不要使用pyplot,因此必须使用面向对象的方法)。 网格中将显示多个绘图,但用户可以定义要显示的绘图数量。我希望图例显示在所有绘图的右侧,因此我不能简单地为最后绘制的轴创建图例。我希望为整个图形创建图例,而不仅仅是最后一个轴(类似于pyplot中的plt.figlegend)。 在我在别处
-
您可以使用“自动对齐图层”命令,利用一对几乎相同,但可能包含一些不需要区域的图像制作复合照片。例如,有一张集体照拍摄得很理想,但其中一个人的眼睛闭上了。而在拍摄的另一张照片中,她的眼睛是睁开的。通过使用自动对齐图层和图层蒙版,可以组合这些照片,从而在最终图像中消除缺陷。 打开要组合的两个图像。 创建与两个源图像的尺寸相同的新图像(“文件”>“新建”)。 在每个源图像的“图层”面板中,选择包含图像内
-
我在MPAndroidChart_GITHUB中使用了3.1.0版本 我试过这个代码 activity_test.xml 首先,更改文件是布局xml activity.java 但这太奇怪了