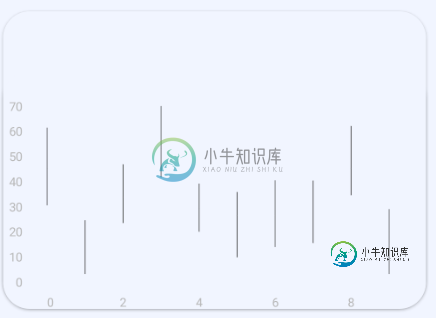
在组合图中绘制蜡烛图和折线图
我在MPAndroidChart_GITHUB中使用了3.1.0版本
我试过这个代码
activity_test.xml
<com.github.mikephil.charting.charts.CandleStickChart
            android:id="@+id/lc_chart1"
            android:layout_width="0dp"
            android:layout_height="0dp"
            android:layout_marginBottom="7dp"
            android:background="@drawable/corner_graph"
            android:elevation="2dp"
            app:layout_constraintBottom_toBottomOf="parent"
            app:layout_constraintEnd_toEndOf="parent"
            app:layout_constraintHeight_percent="0.75"
            app:layout_constraintStart_toStartOf="parent"
            app:layout_constraintWidth_percent="0.90">

</com.github.mikephil.charting.charts.CandleStickChart>
public void initChart() {
        chart.getDescription().setEnabled(false);
        chart.setTouchEnabled(true);
        chart.setDragEnabled(true);
        chart.setPinchZoom(false);
        chart.setDrawBorders(false);
        chart.setVisibleXRangeMinimum(5);
        // enable scaling and dragging
        chart.setScaleEnabled(true);
        chart.setAutoScaleMinMaxEnabled(true);
        chart.setDrawGridBackground(false);

        CandleData data = new CandleData();
        chart.setData(data);

        XAxis x = chart.getXAxis();
        x.setPosition(XAxis.XAxisPosition.BOTTOM);
        x.setTextColor(Color.parseColor("#B8B8B8"));
        x.setDrawGridLines(false);
        x.setDrawAxisLine(false);
        x.setAvoidFirstLastClipping(true);
        x.setEnabled(true);

        YAxis ly = chart.getAxisLeft();
        ly.setTextColor(Color.parseColor("#B8B8B8"));
        ly.setLabelCount(10, false); //
        ly.setDrawGridLines(false);
        ly.setDrawAxisLine(false);
        ly.setAxisLineColor(Color.WHITE);
        YAxis ry = chart.getAxisRight();
        ry.setDrawAxisLine(false);
        ry.setEnabled(false);

        chart.getLegend().setEnabled(false);
}
btn_start.setOnClickListener(new OnSingleClickListener() {
            @Override
            public void onSingleClick(View v) {
                ArrayList<CandleEntry> values = new ArrayList<>();

                for (int i = 0; i < 10; i++) {
                    float multi = 15;
                    float val = (float) (Math.random() * 40) + multi;

                    float high = (float) (Math.random() * 9) + 8f;
                    float low = (float) (Math.random() * 9) + 8f;

                    float open = (float) (Math.random() * 6) + 1f;
                    float close = (float) (Math.random() * 6) + 1f;

                    boolean even = i % 2 == 0;

                    values.add(new CandleEntry(
                            i,
                            val + high,
                            val - low,
                            val,val
//                            even ? val + open : val - open,
//                            even ? val - close : val + close
                    ));
                }

                CandleDataSet set1 = new CandleDataSet(values, "Data Set");
                set1.setDrawIcons(false);
                set1.setAxisDependency(YAxis.AxisDependency.LEFT);
//        set1.setColor(Color.rgb(80, 80, 80));
                set1.setShadowColor(Color.DKGRAY);
                set1.setShadowWidth(0.7f);
                set1.setDrawValues(false);
//                set1.setDecreasingColor(Color.RED);
//                set1.setDecreasingPaintStyle(Paint.Style.FILL);
//                set1.setIncreasingColor(Color.rgb(122, 242, 84));
//                set1.setIncreasingPaintStyle(Paint.Style.STROKE);
//                set1.setNeutralColor(Color.BLUE);
                //set1.setHighlightLineWidth(1f);

                CandleData data = new CandleData(set1);

                chart.setData(data);
                chart.invalidate();
            }
});

首先,更改文件是布局xml
<com.github.mikephil.charting.charts.CombinedChart
            android:id="@+id/lc_chart1"
            android:layout_width="0dp"
            android:layout_height="0dp"
            android:layout_marginBottom="7dp"
            android:background="@drawable/corner_graph"
            android:elevation="2dp"
            app:layout_constraintBottom_toBottomOf="parent"
            app:layout_constraintEnd_toEndOf="parent"
            app:layout_constraintHeight_percent="0.75"
            app:layout_constraintStart_toStartOf="parent"
            app:layout_constraintWidth_percent="0.90">

</com.github.mikephil.charting.charts.CombinedChart>
activity.java
public void initHeartChart() {
        chart.getDescription().setEnabled(false);
        chart.setTouchEnabled(true);
        chart.setDragEnabled(true);
        chart.setPinchZoom(false);
        chart.setDrawBorders(false);

        chart.setVisibleXRangeMinimum(5);
        // enable scaling and dragging
        chart.setScaleEnabled(true);
        chart.setAutoScaleMinMaxEnabled(true);
        chart.setDrawGridBackground(false);

        CombinedData data = new CombinedData();
        chart.setData(data);

        XAxis x = chart.getXAxis();
        x.setPosition(XAxis.XAxisPosition.BOTTOM);
        x.setTextColor(Color.parseColor("#B8B8B8"));
        x.setDrawGridLines(false);
        x.setDrawAxisLine(false);
        x.setAvoidFirstLastClipping(true);
        x.setEnabled(true);

        YAxis ly = chart.getAxisLeft();
        ly.setTextColor(Color.parseColor("#B8B8B8"));
        ly.setLabelCount(10, false); //
        ly.setDrawGridLines(false);
        ly.setDrawAxisLine(false);
        ly.setAxisLineColor(Color.WHITE);
        YAxis ry = chart.getAxisRight();
        ry.setDrawAxisLine(false);
        ry.setEnabled(false);

        chart.getLegend().setEnabled(false);
}
但这太奇怪了

共有1个答案
尝试在xAxis中设置空间
XAxis xAxis = chart.getXAxis();
xAxis.setSpaceMin(barData.getBarWidth() / 2f);
xAxis.setSpaceMax(barData.getBarWidth() / 2f);
或将xAxis最小值设置为-0.5
xAxis.setAxisMinimum(-0.5f);
-
我有一个熊猫数据框,格式如下: 我想要一个排序的线图,其值在y轴上,如下所示: 不管怎样:我也希望在同一个情节中的每一组都有相似的台词。(或者只是组的两行,但它们的大小不同) 有人能帮我吗?我想这是可能的? 我使用Python3.x和pandas 0.16.2。我更喜欢使用matplotlib或seaborn。
-
我想创建一个包含三条线(男性、女性、未知)的折线图。这是我的数据示例: 是否有一个选项,在图中自动创建三行或我需要循环通过数据和创建三个跟踪自己?到目前为止,这是我的代码:
-
我试图画一个三次线图,如下所示: 使用MPAndroid图表库。 我能画线,但不能画X轴和线之间的填充,如图所示。 已经经历了库和许多这样的问题。
-
假设我有多行,其中一行我想隐藏。如何做到这一点?将删除完整的行,但我只想隐藏该行。在这个图表API中有可能吗?
-
本文向大家介绍Android绘制动态折线图,包括了Android绘制动态折线图的使用技巧和注意事项,需要的朋友参考一下 所谓动态折线图,就是折线图能随着手指的滑动进行动态绘制,这里很定会产生动画效果。基于这个效果,这里使用SurfaceView进行制图。 实现步奏如下: (1): 这里新建一个绘图ChartView,继承SurfaceView并实现SurfaceHolder.Callback ,
-
本文向大家介绍C# 绘制实时折线图,波形图,包括了C# 绘制实时折线图,波形图的使用技巧和注意事项,需要的朋友参考一下 此Demo是采用VS自带的Chart图表控件,制作实时动态显示的折线图,和波形图。本文仅供学习分享使用,如有不足之处,还请指正。 涉及知识点: Chart 控件,功能强大,可以绘制柱状图,折线图,波形图,饼状图,大大简化了对图的开发与定制。 Chart控件的相关概念: C

