
D3甘特图中的任务默认重叠-需要将它们向下移动

我正在使用使用d3开发的甘特图Dimitry Kudryavtsev实现一个日历小部件。我有活动——在这种情况下,这将是任务。我需要根据日历视图/日期显示事件的时间表。
我想要一个解决方案来避免在同一时间线上的任务重叠。我们怎么做?
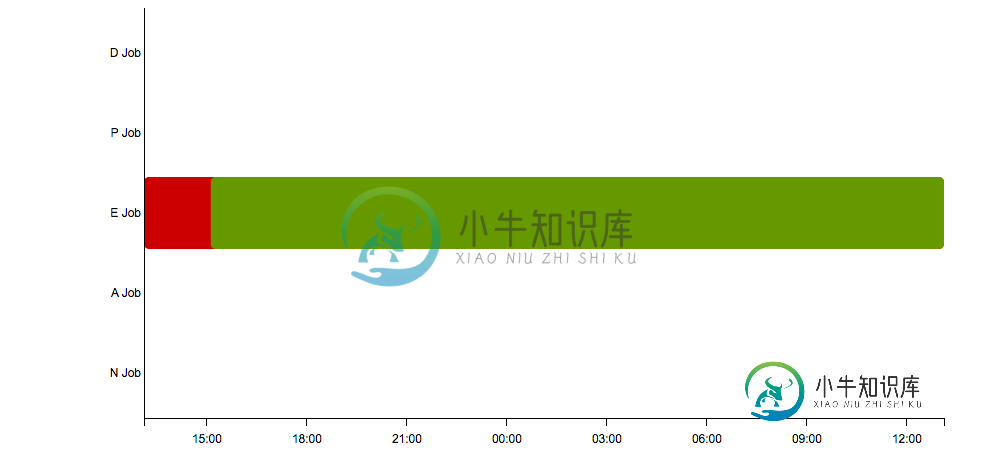
例如,在当前的实施任务中,正如预期的那样重叠:
(a)(b)
|------[----|----]
我想要这样
(a)
|---------|
......[-------](b)
在这里拉小提琴
这里的官方例子
我们必须修改d3甘特图代码
 /**
 * @author Dimitry Kudrayvtsev
 * @version 2.0
 */

d3.gantt = function() {
    var FIT_TIME_DOMAIN_MODE = "fit";
    var FIXED_TIME_DOMAIN_MODE = "fixed";

    var margin = {
    top : 20,
    right : 40,
    bottom : 20,
    left : 150
    };
    var timeDomainStart = d3.time.day.offset(new Date(),-3);
    var timeDomainEnd = d3.time.hour.offset(new Date(),+3);
    var timeDomainMode = FIT_TIME_DOMAIN_MODE;// fixed or fit
    var taskTypes = [];
    var taskStatus = [];
    var height = document.body.clientHeight - margin.top - margin.bottom-5;
    var width = document.body.clientWidth - margin.right - margin.left-5;

    var tickFormat = "%H:%M";

    var keyFunction = function(d) {
    return d.startDate + d.taskName + d.endDate;
    };

    var rectTransform = function(d) {
    return "translate(" + x(d.startDate) + "," + y(d.taskName) + ")";
    };

    var x = d3.time.scale().domain([ timeDomainStart, timeDomainEnd ]).range([ 0, width ]).clamp(true);

    var y = d3.scale.ordinal().domain(taskTypes).rangeRoundBands([ 0, height - margin.top - margin.bottom ], .1);

    var xAxis = d3.svg.axis().scale(x).orient("bottom").tickFormat(d3.time.format(tickFormat)).tickSubdivide(true)
        .tickSize(8).tickPadding(8);

    var yAxis = d3.svg.axis().scale(y).orient("left").tickSize(0);

    var initTimeDomain = function() {
    if (timeDomainMode === FIT_TIME_DOMAIN_MODE) {
        if (tasks === undefined || tasks.length < 1) {
        timeDomainStart = d3.time.day.offset(new Date(), -3);
        timeDomainEnd = d3.time.hour.offset(new Date(), +3);
        return;
        }
        tasks.sort(function(a, b) {
        return a.endDate - b.endDate;
        });
        timeDomainEnd = tasks[tasks.length - 1].endDate;
        tasks.sort(function(a, b) {
        return a.startDate - b.startDate;
        });
        timeDomainStart = tasks[0].startDate;
    }
    };

    var initAxis = function() {
    x = d3.time.scale().domain([ timeDomainStart, timeDomainEnd ]).range([ 0, width ]).clamp(true);
    y = d3.scale.ordinal().domain(taskTypes).rangeRoundBands([ 0, height - margin.top - margin.bottom ], .1);
    xAxis = d3.svg.axis().scale(x).orient("bottom").tickFormat(d3.time.format(tickFormat)).tickSubdivide(true)
        .tickSize(8).tickPadding(8);

    yAxis = d3.svg.axis().scale(y).orient("left").tickSize(0);
    };

    function gantt(tasks) {

    initTimeDomain();
    initAxis();

    var svg = d3.select("body")
    .append("svg")
    .attr("class", "chart")
    .attr("width", width + margin.left + margin.right)
    .attr("height", height + margin.top + margin.bottom)
    .append("g")
        .attr("class", "gantt-chart")
    .attr("width", width + margin.left + margin.right)
    .attr("height", height + margin.top + margin.bottom)
    .attr("transform", "translate(" + margin.left + ", " + margin.top + ")");

      svg.selectAll(".chart")
     .data(tasks, keyFunction).enter()
     .append("rect")
     .attr("rx", 5)
         .attr("ry", 5)
     .attr("class", function(d){
         if(taskStatus[d.status] == null){ return "bar";}
         return taskStatus[d.status];
         })
     .attr("y", 0)
     .attr("transform", rectTransform)
     .attr("height", function(d) { return y.rangeBand(); })
     .attr("width", function(d) {
         return (x(d.endDate) - x(d.startDate));
         });


     svg.append("g")
     .attr("class", "x axis")
     .attr("transform", "translate(0, " + (height - margin.top - margin.bottom) + ")")
     .transition()
     .call(xAxis);

     svg.append("g").attr("class", "y axis").transition().call(yAxis);

     return gantt;

    };

    gantt.redraw = function(tasks) {

    initTimeDomain();
    initAxis();

        var svg = d3.select("svg");

        var ganttChartGroup = svg.select(".gantt-chart");
        var rect = ganttChartGroup.selectAll("rect").data(tasks, keyFunction);

        rect.enter()
         .insert("rect",":first-child")
         .attr("rx", 5)
         .attr("ry", 5)
     .attr("class", function(d){
         if(taskStatus[d.status] == null){ return "bar";}
         return taskStatus[d.status];
         })
     .transition()
     .attr("y", 0)
     .attr("transform", rectTransform)
     .attr("height", function(d) { return y.rangeBand(); })
     .attr("width", function(d) {
         return (x(d.endDate) - x(d.startDate));
         });

        rect.transition()
          .attr("transform", rectTransform)
     .attr("height", function(d) { return y.rangeBand(); })
     .attr("width", function(d) {
         return (x(d.endDate) - x(d.startDate));
         });

    rect.exit().remove();

    svg.select(".x").transition().call(xAxis);
    svg.select(".y").transition().call(yAxis);

    return gantt;
    };

    gantt.margin = function(value) {
    if (!arguments.length)
        return margin;
    margin = value;
    return gantt;
    };

    gantt.timeDomain = function(value) {
    if (!arguments.length)
        return [ timeDomainStart, timeDomainEnd ];
    timeDomainStart = +value[0], timeDomainEnd = +value[1];
    return gantt;
    };

    /**
     * @param {string}
     *                vale The value can be "fit" - the domain fits the data or
     *                "fixed" - fixed domain.
     */
    gantt.timeDomainMode = function(value) {
    if (!arguments.length)
        return timeDomainMode;
        timeDomainMode = value;
        return gantt;

    };

    gantt.taskTypes = function(value) {
    if (!arguments.length)
        return taskTypes;
    taskTypes = value;
    return gantt;
    };

    gantt.taskStatus = function(value) {
    if (!arguments.length)
        return taskStatus;
    taskStatus = value;
    return gantt;
    };

    gantt.width = function(value) {
    if (!arguments.length)
        return width;
    width = +value;
    return gantt;
    };

    gantt.height = function(value) {
    if (!arguments.length)
        return height;
    height = +value;
    return gantt;
    };

    gantt.tickFormat = function(value) {
    if (!arguments.length)
        return tickFormat;
    tickFormat = value;
    return gantt;
    };


    return gantt;
};
我们将这些数据传递给该代码:
var tasks = [
{"startDate":new Date("Sun Dec 08 04:36:45 EST 2012"),"endDate":new Date("Sun Dec 09 02:36:45 EST 2012"),"taskName":"E Job","status":"RUNNING"},
    {"startDate":new Date("Sun Dec 07 01:36:45 EST 2012"),"endDate":new Date("Sun Dec 09 02:36:45 EST 2012"),"taskName":"E Job","status":"FAILED"}];

var taskStatus = {
    "SUCCEEDED" : "bar",
    "FAILED" : "bar-failed",
    "RUNNING" : "bar-running",
    "KILLED" : "bar-killed"
};

var taskNames = [ "D Job", "P Job", "E Job", "A Job", "N Job" ];
我不需要显示y轴数据,所以我们可以玩那个轴——我们可以隐藏那些刻度。(Y轴数据对我来说并不重要,我们可以在上面玩把戏)
共有1个答案

我觉得你应该调查http://codepen.io/jey/pen/jmClJ/.
  var w = 800;
  var h = 400;


  var svg = d3.selectAll(".svg")
  //.selectAll("svg")
  .append("svg")
  .attr("width", w)
  .attr("height", h)
  .attr("class", "svg");


    var taskArray = [
  {
    task: "conceptualize",
    type: "development",
    startTime: "2013-1-28", //year/month/day
    endTime: "2013-2-1",
    details: "This actually didn't take any conceptualization"
},

{
    task: "sketch",
    type: "development",
    startTime: "2013-2-1",
    endTime: "2013-2-6",
    details: "No sketching either, really"
},

{
    task: "color profiles",
    type: "development",
    startTime: "2013-2-6",
    endTime: "2013-2-9"
},

{
    task: "HTML",
    type: "coding",
    startTime: "2013-2-2",
    endTime: "2013-2-6",
    details: "all three lines of it"
},

{
    task: "write the JS",
    type: "coding",
    startTime: "2013-2-6",
    endTime: "2013-2-9"
},

{
    task: "advertise",
    type: "promotion",
    startTime: "2013-2-9",
    endTime: "2013-2-12",
    details: "This counts, right?"
},

{
    task: "spam links",
    type: "promotion",
    startTime: "2013-2-12",
    endTime: "2013-2-14"
},
{
    task: "eat",
    type: "celebration",
    startTime: "2013-2-8",
    endTime: "2013-2-13",
    details: "All the things"
},

{
    task: "crying",
    type: "celebration",
    startTime: "2013-2-13",
    endTime: "2013-2-16"
},

];

var dateFormat = d3.time.format("%Y-%m-%d");

var timeScale = d3.time.scale()
        .domain([d3.min(taskArray, function(d) {return dateFormat.parse(d.startTime);}),
                 d3.max(taskArray, function(d) {return dateFormat.parse(d.endTime);})])
        .range([0,w-150]);

var categories = new Array();

for (var i = 0; i < taskArray.length; i++){
    categories.push(taskArray[i].type);
}

var catsUnfiltered = categories; //for vert labels

categories = checkUnique(categories);


makeGant(taskArray, w, h);

var title = svg.append("text")
              .text("Gantt Chart Process")
              .attr("x", w/2)
              .attr("y", 25)
              .attr("text-anchor", "middle")
              .attr("font-size", 18)
              .attr("fill", "#009FFC");


function makeGant(tasks, pageWidth, pageHeight){

var barHeight = 20;
var gap = barHeight + 4;
var topPadding = 75;
var sidePadding = 75;

var colorScale = d3.scale.linear()
    .domain([0, categories.length])
    .range(["#00B9FA", "#F95002"])
    .interpolate(d3.interpolateHcl);

makeGrid(sidePadding, topPadding, pageWidth, pageHeight);
drawRects(tasks, gap, topPadding, sidePadding, barHeight, colorScale, pageWidth, pageHeight);
vertLabels(gap, topPadding, sidePadding, barHeight, colorScale);

}


function drawRects(theArray, theGap, theTopPad, theSidePad, theBarHeight, theColorScale, w, h){

var bigRects = svg.append("g")
    .selectAll("rect")
   .data(theArray)
   .enter()
   .append("rect")
   .attr("x", 0)
   .attr("y", function(d, i){
      return i*theGap + theTopPad - 2;
  })
   .attr("width", function(d){
      return w-theSidePad/2;
   })
   .attr("height", theGap)
   .attr("stroke", "none")
   .attr("fill", function(d){
    for (var i = 0; i < categories.length; i++){
        if (d.type == categories[i]){
          return d3.rgb(theColorScale(i));
        }
    }
   })
   .attr("opacity", 0.2);


     var rectangles = svg.append('g')
     .selectAll("rect")
     .data(theArray)
     .enter();


   var innerRects = rectangles.append("rect")
             .attr("rx", 3)
             .attr("ry", 3)
             .attr("x", function(d){
              return timeScale(dateFormat.parse(d.startTime)) + theSidePad;
              })
             .attr("y", function(d, i){
                return i*theGap + theTopPad;
            })
             .attr("width", function(d){
                return (timeScale(dateFormat.parse(d.endTime))-timeScale(dateFormat.parse(d.startTime)));
             })
             .attr("height", theBarHeight)
             .attr("stroke", "none")
             .attr("fill", function(d){
              for (var i = 0; i < categories.length; i++){
                  if (d.type == categories[i]){
                    return d3.rgb(theColorScale(i));
                  }
              }
             })


         var rectText = rectangles.append("text")
               .text(function(d){
                return d.task;
               })
               .attr("x", function(d){
                return (timeScale(dateFormat.parse(d.endTime))-timeScale(dateFormat.parse(d.startTime)))/2 + timeScale(dateFormat.parse(d.startTime)) + theSidePad;
                })
               .attr("y", function(d, i){
                  return i*theGap + 14+ theTopPad;
              })
               .attr("font-size", 11)
               .attr("text-anchor", "middle")
               .attr("text-height", theBarHeight)
               .attr("fill", "#fff");


rectText.on('mouseover', function(e) {
 // console.log(this.x.animVal.getItem(this));
               var tag = "";

         if (d3.select(this).data()[0].details != undefined){
          tag = "Task: " + d3.select(this).data()[0].task + "<br/>" +
                "Type: " + d3.select(this).data()[0].type + "<br/>" +
                "Starts: " + d3.select(this).data()[0].startTime + "<br/>" +
                "Ends: " + d3.select(this).data()[0].endTime + "<br/>" +
                "Details: " + d3.select(this).data()[0].details;
         } else {
          tag = "Task: " + d3.select(this).data()[0].task + "<br/>" +
                "Type: " + d3.select(this).data()[0].type + "<br/>" +
                "Starts: " + d3.select(this).data()[0].startTime + "<br/>" +
                "Ends: " + d3.select(this).data()[0].endTime;
         }
         var output = document.getElementById("tag");

          var x = this.x.animVal.getItem(this) + "px";
          var y = this.y.animVal.getItem(this) + 25 + "px";

         output.innerHTML = tag;
         output.style.top = y;
         output.style.left = x;
         output.style.display = "block";
       }).on('mouseout', function() {
         var output = document.getElementById("tag");
         output.style.display = "none";
             });


innerRects.on('mouseover', function(e) {
 //console.log(this);
         var tag = "";

         if (d3.select(this).data()[0].details != undefined){
          tag = "Task: " + d3.select(this).data()[0].task + "<br/>" +
                "Type: " + d3.select(this).data()[0].type + "<br/>" +
                "Starts: " + d3.select(this).data()[0].startTime + "<br/>" +
                "Ends: " + d3.select(this).data()[0].endTime + "<br/>" +
                "Details: " + d3.select(this).data()[0].details;
         } else {
          tag = "Task: " + d3.select(this).data()[0].task + "<br/>" +
                "Type: " + d3.select(this).data()[0].type + "<br/>" +
                "Starts: " + d3.select(this).data()[0].startTime + "<br/>" +
                "Ends: " + d3.select(this).data()[0].endTime;
         }
         var output = document.getElementById("tag");

         var x = (this.x.animVal.value + this.width.animVal.value/2) + "px";
         var y = this.y.animVal.value + 25 + "px";

         output.innerHTML = tag;
         output.style.top = y;
         output.style.left = x;
         output.style.display = "block";
       }).on('mouseout', function() {
         var output = document.getElementById("tag");
         output.style.display = "none";

 });


}


function makeGrid(theSidePad, theTopPad, w, h){

var xAxis = d3.svg.axis()
    .scale(timeScale)
    .orient('bottom')
    .ticks(d3.time.days, 1)
    .tickSize(-h+theTopPad+20, 0, 0)
    .tickFormat(d3.time.format('%d %b'));

var grid = svg.append('g')
    .attr('class', 'grid')
    .attr('transform', 'translate(' +theSidePad + ', ' + (h - 50) + ')')
    .call(xAxis)
    .selectAll("text")
            .style("text-anchor", "middle")
            .attr("fill", "#000")
            .attr("stroke", "none")
            .attr("font-size", 10)
            .attr("dy", "1em");
}

function vertLabels(theGap, theTopPad, theSidePad, theBarHeight, theColorScale){
  var numOccurances = new Array();
  var prevGap = 0;

  for (var i = 0; i < categories.length; i++){
    numOccurances[i] = [categories[i], getCount(categories[i], catsUnfiltered)];
  }

  var axisText = svg.append("g") //without doing this, impossible to put grid lines behind text
   .selectAll("text")
   .data(numOccurances)
   .enter()
   .append("text")
   .text(function(d){
    return d[0];
   })
   .attr("x", 10)
   .attr("y", function(d, i){
    if (i > 0){
        for (var j = 0; j < i; j++){
          prevGap += numOccurances[i-1][1];
         // console.log(prevGap);
          return d[1]*theGap/2 + prevGap*theGap + theTopPad;
        }
    } else{
    return d[1]*theGap/2 + theTopPad;
    }
   })
   .attr("font-size", 11)
   .attr("text-anchor", "start")
   .attr("text-height", 14)
   .attr("fill", function(d){
    for (var i = 0; i < categories.length; i++){
        if (d[0] == categories[i]){
        //  console.log("true!");
          return d3.rgb(theColorScale(i)).darker();
        }
    }
   });

}

//from this stackexchange question: http://stackoverflow.com/questions/1890203/unique-for-arrays-in-javascript
function checkUnique(arr) {
    var hash = {}, result = [];
    for ( var i = 0, l = arr.length; i < l; ++i ) {
        if ( !hash.hasOwnProperty(arr[i]) ) { //it works with objects! in FF, at least
            hash[ arr[i] ] = true;
            result.push(arr[i]);
        }
    }
    return result;
}

//from this stackexchange question: http://stackoverflow.com/questions/14227981/count-how-many-strings-in-an-array-have-duplicates-in-the-same-array
function getCounts(arr) {
    var i = arr.length, // var to loop over
        obj = {}; // obj to store results
    while (i) obj[arr[--i]] = (obj[arr[i]] || 0) + 1; // count occurrences
    return obj;
}

// get specific from everything
function getCount(word, arr) {
    return getCounts(arr)[word] || 0;
}
-
我回顾了这个问题的答案,其中提出了一些后续问题,涉及将解决方案泛化以支持每个类别的可变行数,现在我已经准备好了代码,可以将各种任务拆分为所需的行。 我已经使用了原来的小提琴并对其进行了修改,看到这里可以更好地理解这个概念。 我可以看到我们有一个必须一起工作的数字。我们首先似乎需要为每个将有多行的类别中断,我们需要将“y”属性设置为类别偏移量的十进制部分,并且我们需要在类别系列上应用翻译。 目前尚不
-
在使用树状网格和子任务实现HC甘特图时,我注意到在示例中,折叠带有子项的项目将显示子项的详细信息,但并不总是这样。 查看标准项目管理示例(jsfiddle.net/gh/get/library/pure/highcharts/highcharts/tree/master/samples/gantt/demo/project-management),如果我们折叠“新办公室”节点,它将显示下面的子节点
-
我计划使用python库“Plotly”构建甘特图。具体而言:https://plotly.com/python/gantt/#group-一起完成任务。 然而,每个“作业”可以有多个任务,并且这些任务可以并行运行。从我观察到的情况来看,Plotly并没有将并行运行的任务堆叠在一起,这使得读取图表非常困难。下面是一个示例,“作业A”有两个并行运行的任务,但只有一个可见: 我想要的是“作业A”任务都
-
我将甘特图(ChartPanel)放在JScrollPane中,并创建一个名为[zoom in]的按钮。 按钮[zoom in]的功能是: 当我单击[zoom in]按钮时,图表面板的宽度将加倍。 点击【放大】按钮后,会出现JScrollPane的滚动条。 然后用户可以在放大后滚动观看整个图表。 但是有一个问题,当我加倍图表面板宽度时,任务标签字体也会放大。 在我把图表面板的宽度增加一倍后,有没有
-
我使用order\u branch config拖放任务(http://docs.dhtmlx.com/gantt/api__gantt_order_branch_config.html). 它工作正常,但我发现我不能滚动图表时,我拖动。所以我不能将任务拖出可见区域(顶部和底部)。如何配置dhtmlxGantt来实现这一点?
-
甘特图用于比较类别之间的数据。此外,它还可用于识别每个过程所花费的时间。 它显示了一段时间内任务值的进展。它在一段时间内广泛用于项目管理和其他类型的变异研究。 除时间维度外,甘特图也采用维度和度量。 例如,使用Sample-Superstore数据源,可以按照每种类型的发运模式进行运输。对于创建,甘特图遵循程序如下: 第1步:转到工作表。 单击“标记(Marks)”窗格中的下拉按钮。 从给定列表中