
Chart.js-条形图上的水平线干扰工具提示

我使用的是Chart.js2.6,我已经实现了horizontalLine插件,在条形图上显示平均值。它可以正常工作,但是当工具提示显示在与直线相交的位置时,它部分被水平线本身覆盖。我试图找出如何使工具提示在水平线上方绘制。
我知道工具提示是canvas元素的一部分,因此没有z-index属性。我怎样才能做到这一点?
下面是我使用的水平线插件。
var horizonalLinePlugin = {
    afterDraw: function(chartInstance) {
        var yScale = chartInstance.scales["y-axis-0"];
        var canvas = chartInstance.chart;
        var ctx = canvas.ctx;
        var index, line, style, width;
        if (chartInstance.options.horizontalLine) {
            for (index = 0; index < chartInstance.options.horizontalLine.length; index++) {
                line = chartInstance.options.horizontalLine[index];
                style = (line.style) ? line.style : "rgba(169,169,169, .6)";
                yValue = (line.y) ? yScale.getPixelForValue(line.y) : 0 ;
                ctx.lineWidth = (line.width) ? line.width : 3;
                if (yValue) {
                    ctx.beginPath();
                    ctx.moveTo(chartInstance.chartArea.left, yValue);
                    ctx.lineTo(canvas.width, yValue);
                    ctx.strokeStyle = style;
                    ctx.stroke();
                }
                if (line.text) {
                    ctx.fillStyle = style;
                    ctx.fillText(line.text, 0, yValue + ctx.lineWidth);
                }
            }
            return;
        }
    }
};

Chart.pluginService.register(horizonalLinePlugin);
... 然后我使用以下命令将其添加到条形图选项中
options: {
     ...standard option stuff...
     "horizontalLine": [{
          "y": averageValue,
          "style" : colorOfTheLine
     }]
}
它生成一个图表,看起来像下面这个。
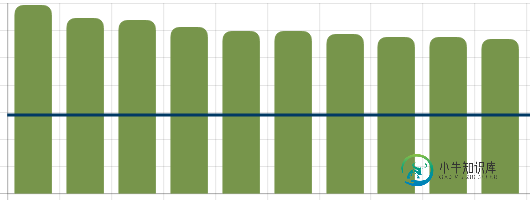
…但是,当您将鼠标悬停在图表的某个部分上以显示工具提示,并且工具提示位于水平线的路径中时,会导致如下所示的问题。

共有1个答案

将插件连接到afterDatasetDraw挂钩,而不是afterDraw。这将使水平线在工具提示之前绘制。
var horizonalLinePlugin = {
   afterDatasetDraw: function(chartInstance) {
      var yScale = chartInstance.scales["y-axis-0"];
      var canvas = chartInstance.chart;
      var ctx = canvas.ctx;
      var index, line, style, width;
      if (chartInstance.options.horizontalLine) {
         for (index = 0; index < chartInstance.options.horizontalLine.length; index++) {
            line = chartInstance.options.horizontalLine[index];
            style = (line.style) ? line.style : "rgba(169,169,169, .6)";
            yValue = (line.y) ? yScale.getPixelForValue(line.y) : 0;
            ctx.lineWidth = (line.width) ? line.width : 3;
            if (yValue) {
               ctx.beginPath();
               ctx.moveTo(chartInstance.chartArea.left, yValue);
               ctx.lineTo(canvas.width, yValue);
               ctx.strokeStyle = style;
               ctx.stroke();
            }
            if (line.text) {
               ctx.fillStyle = style;
               ctx.fillText(line.text, 0, yValue + ctx.lineWidth);
            }
         }
         return;
      }
   }
};

Chart.pluginService.register(horizonalLinePlugin);

new Chart(canvas, {
   type: 'bar',
   data: {
      labels: ["January", "February"],
      datasets: [{
         label: "Dataset 1",
         data: [80, 50]
      }]
   },
   options: {
      scales: {
         yAxes: [{
            ticks: {
               beginAtZero: true
            }
         }]
      },
      horizontalLine: [{
         y: 50,
         style: 'red'
      }]
   }
});
<script src="https://cdnjs.cloudflare.com/ajax/libs/Chart.js/2.6.0/Chart.min.js"></script>
<canvas id="canvas"></canvas>-
我使用Chart.js库绘制条形图,我想显示工具提示不仅在条形图悬停,而且在x轴标签悬停该条形图。我找到了用于配置的方法,但它只允许我访问当前悬停栏的数组,这是没有用的。 那个么,我怎样才能访问鼠标事件,并从那个里获取位置,将其与条形标签的位置进行比较呢?还是有别的办法? 我当前的配置: 它只打印出悬停条数据,但我坚持要想出如何扩展它以满足我需要的行为。
-
如贴图所示,我正在尝试使用MPAndroid libraray的水平条形图,一切都很好,除了在图的末尾有一条十字线,如图所示。我还附上了图表样式的代码。请有人帮忙纠正我代码中的错误。 MpChart错误的图像:
-
以下是分组水平条形图: http://jsfiddle.net/jmpxgufu/185/ var ctx=document.getElementById(“myChart”).getContext(“2d”); 如果你看一下图表,有两个条形(一个橙色和一个蓝色)与标签“Topic1”相关联。 当我悬停在橙色条上时,它说: 当我悬停在蓝色条上时,它说: 您还会注意到,因为组中有两个条,所以函数执行
-
我使用chart.js在我的网页上有一个BarChart。 我在其中添加了两个数据点 现在我想要更新那些条A和B,而不是删除它们并再次添加它们(我已经想好了如何做到这一点)。我想让它们垂直移动以适应它们的新值,但我无法找到如何访问图表中已经存在的数据。 没有什么比得上 其中第一个值将是存储数据的索引(F.E.)。 我该怎么做呢?
-
我正在尝试使用2.3.0绘制chart.js水平条形图- 但它只显示一个小节。我错过了什么?
-
我正在使用MPAndroidChart库。在条形图中,默认情况下,所有条形图都是垂直的(自下而上),如何水平显示?