
如何在Angular10项目中使用chart.js在条形图上显示数据标签?

在Angular项目中,我正在使用chart.js最新版本2.9.3实现图表
我实现了圆环图,完美地堆叠条形图,现在我必须实现在y轴上包含数据标签的堆叠条形图。
从图表上看也是如此。js文档:使用chartjs插件datalabels插件。我试图在这里显示标签。我得到了cli错误:decalare module chart.js

为了解决上面的错误,我安装了“@ types/chart . js”:“^2.9.27”,按照这个解决方案https://github . com/chart js/chart js-plugin-data labels/pull/121 # issue comment-473327301
现在在我的package.json
-
 "@types/chart.js": "^2.9.27",
       "chart.js": "^2.9.3",
       "chartjs-plugin-datalabels": "^0.7.0",
但是在安装@types之后,我遇到了很多cli错误,这是以前没有的
  The types of 'elements.point.pointStyle' are incompatible between these types.
    Type 'string' is not assignable to type 'PointStyle'


  The expected type comes from property 'options' which is declared here on type 'ChartConfiguration'
src/app/dashboard1/litmus-utilization-chart/litmus-utilization-chart.component.ts:48:11 - error TS2339: Property 'elements' does not exist on type 'typeof Chart'.

48     Chart.elements.Rectangle.prototype.draw = function () {


  Object literal may only specify known properties, and 'yAlign' does not exist in type 'ChartTooltipOptions'.

352             yAlign: "top",
            ~~~~~~~~~~~~~
node_modules/@types/chart.js/index.d.ts:297:9 297 工具提示?: ChartTooltipOptions;
什么是酶错误,如何解决酶,,
但在stackerzbilz ANgular 10项目工作正常,不了解问题的根本原因https://stackblitz.com/edit/angular-10-base-template-2hul5i
My Package.json
    {
  "name": "Litmus",
  "version": "0.0.0",
  "scripts": {
    "ng": "ng",
    "start": "ng serve --open",
    "build": "ng build",
    "build:prod": "ng build --configuration production",
    "test": "jest",
    "lint": "ng lint",
    "e2e": "ng e2e"
  },
  "private": true,
  "jest": {
    "preset": "jest-preset-angular",
    "setupFilesAfterEnv": [
      "<rootDir>/setupJest.ts"
    ],
    "testPathIgnorePatterns": [
      "<rootDir>/node_modules/",
      "<rootDir>/dist/",
      "<rootDir>/src/test.ts"
    ]
  },
  "dependencies": {
    "@angular/animations": "^10.0.11",
    "@angular/cdk": "^10.1.3",
    "@angular/common": "~10.0.1",
    "@angular/compiler": "~10.0.1",
    "@angular/core": "~10.0.1",
    "@angular/forms": "~10.0.1",
    "@angular/material": "^10.1.3",
    "@angular/platform-browser": "~10.0.1",
    "@angular/platform-browser-dynamic": "~10.0.1",
    "@angular/router": "~10.0.1",
    "@volo/abp.ng.account": "~3.0.4",
    "@volo/abp.ng.audit-logging": "~3.0.4",
    "@volo/abp.ng.identity": "~3.0.4",
    "@volo/abp.ng.identity-server": "~3.0.4",
    "@volo/abp.ng.language-management": "~3.0.4",
    "@volo/abp.ng.saas": "~3.0.4",
    "@volo/abp.ng.text-template-management": "~3.0.4",
    "@volo/abp.ng.theme.lepton": "~3.0.4",
    "chart.js": "^2.9.3",
    "chartjs-plugin-datalabels": "^0.7.0",
    "jest": "^26.0.1",
    "jest-preset-angular": "^8.2.1",
    "moment": "^2.29.1",
    "moment-timezone": "^0.5.31",
    "rxjs": "~6.5.4",
    "tslib": "^2.0.0",
    "zone.js": "~0.10.2"
  },
  "devDependencies": {
    "@angular-devkit/build-angular": "~0.1000.0",
    "@angular-devkit/build-ng-packagr": "~0.1000.0",
    "@angular/cli": "~10.0.0",
    "@angular/compiler-cli": "~10.0.1",
    "@angular/language-service": "~10.0.1",
    "@ngxs/logger-plugin": "^3.6.2",
    "@types/jasmine": "~3.5.0",
    "@types/jasminewd2": "~2.0.3",
    "@types/node": "^12.11.1",
    "codelyzer": "^5.1.2",
    "jasmine-core": "~3.5.0",
    "jasmine-spec-reporter": "~5.0.0",
    "karma": "~5.0.0",
    "karma-chrome-launcher": "~3.1.0",
    "karma-coverage-istanbul-reporter": "~3.0.2",
    "karma-jasmine": "~3.3.0",
    "karma-jasmine-html-reporter": "^1.5.0",
    "ng-packagr": "^10.0.0",
    "ngxs-schematic": "^1.1.9",
    "protractor": "~7.0.0",
    "ts-node": "~8.3.0",
    "tslint": "~6.1.0",
    "typescript": "~3.9.5"
  }
}
tsconfig.json
{
  "compileOnSave": false,
  "compilerOptions": {
    "baseUrl": "./",
    "outDir": "./dist/out-tsc",
    "sourceMap": true,
    "declaration": false,
    "downlevelIteration": true,
    "experimentalDecorators": true,
    "module": "esnext",
    "moduleResolution": "node",
    "importHelpers": true,
    "target": "es2015",
    "typeRoots": [
      "node_modules/@types"
    ],
    "lib": [
      "es2018",
      "dom"
    ]
  },
  "angularCompilerOptions": {
    "fullTemplateTypeCheck": true,
    "strictInjectionParameters": true
  }
}
tsconfig.app.json
{
  "extends": "./tsconfig.json",
  "compilerOptions": {
    "outDir": "./out-tsc/app",
    "types": []
  },
  "files": [
    "src/main.ts",
    "src/polyfills.ts"
  ],
  "include": [
    "src/**/*.d.ts"
  ]
}
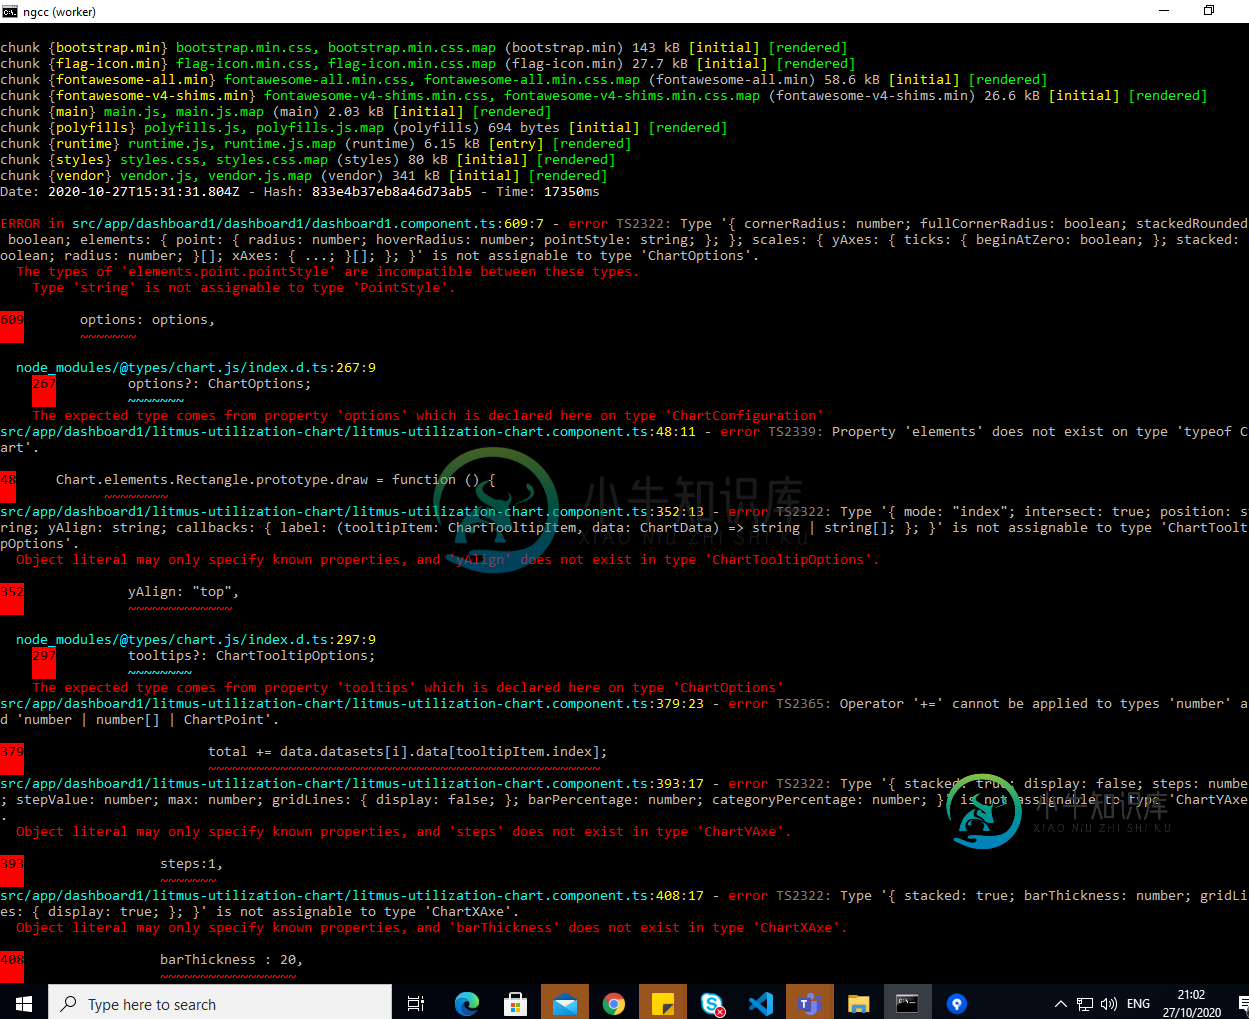
添加“@type/chart.js”后:“^2.9.27”,上面出现错误图像2,如果我没有添加获取错误图像-1
请提出任何建议
预先感谢
共有1个答案

带标签的示例图表如下
import { Component } from '@angular/core';

@Component({
  selector: 'app-root',
  templateUrl: './app.component.html',
  styleUrls: ['./app.component.css']
})
export class AppComponent {
  title = 'Bar Chart Example in Angular 4';

  // ADD CHART OPTIONS.
  chartOptions = {
    responsive: true    // THIS WILL MAKE THE CHART RESPONSIVE (VISIBLE IN ANY DEVICE).
  }

  labels =  ['JAN', 'FEB', 'MAR', 'APR', 'MAY', 'JUN', 'JUL', 'AUG', 'SEP', 'OCT', 'NOV', 'DEC'];

  // STATIC DATA FOR THE CHART IN JSON FORMAT.
  chartData = [
    {
      label: '1st Year',
      data: [21, 56, 4, 31, 45, 15, 57, 61, 9, 17, 24, 59]
    },
    {
      label: '2nd Year',
      data: [47, 9, 28, 54, 77, 51, 24]
    }
  ];

  // CHART COLOR.
  colors = [
    { // 1st Year.
      backgroundColor: 'rgba(77,83,96,0.2)'
    },
    { // 2nd Year.
      backgroundColor: 'rgba(30, 169, 224, 0.8)'
    }
  ]

  // CHART CLICK EVENT.
  onChartClick(event) {
    console.log(event);
  }
}
-
我使用Chart.js库绘制条形图,我想显示工具提示不仅在条形图悬停,而且在x轴标签悬停该条形图。我找到了用于配置的方法,但它只允许我访问当前悬停栏的数组,这是没有用的。 那个么,我怎样才能访问鼠标事件,并从那个里获取位置,将其与条形标签的位置进行比较呢?还是有别的办法? 我当前的配置: 它只打印出悬停条数据,但我坚持要想出如何扩展它以满足我需要的行为。
-
我最近更新了我的charts.js库到最新版本(2.5.0)。这个版本不显示图表上的标签。 我有一个在《小提琴手:http://jsfiddle.net/g6fajwg8》上工作的例子。 但是,我完全按照示例中的方式定义了我的图表,但仍然看不到图表上的标签。 注意:在Google和Stackoverflow上有很多这样的问题,但其中大多数都是关于以前的版本,这些版本在它们上运行良好。
-
我一直在使用Chart.Js,但由于时间限制和个人对D3等人的SVG路线的偏好,我尽最大努力避免进入画布本身。 我在仪表板页面上混合了各种图表,除了一个问题外,其他一切看起来都很棒——你必须将鼠标悬停在饼图段上才能看到潜在的%或值。 对于仪表板视图,我的用户更喜欢快速查看数据段上的一些数据标签,就像Excel一样,可能更容易用图像进行解释: https://support.office.com/e
-
我有一个条形图,每个条形图上都有一个标签。 悬停前: 悬停后: 这是我的代码: 我使用的chartjs版本是2.7.3
-
我有一个这样的数据帧: 现在,我想绘制水平条形图,其中平台名称位于相应的条形图中,使其看起来像这样: 我该怎么做?
-
问题内容: 我生成了条形图,如何在每个条形上显示条形的值? 我的代码: 问题答案: 加: 结果: 值既是位置,也是的字符串值,方便地,条形图的每个条形的度量均为,因此枚举是位置。