
之前需要在Scala中用到类似Python的graphviz库的功能,用来在MXNet中可视化网络结构,但是在网上搜索了一下,没有找到好用的库,所以就自己去把python的graphviz库中的主要功能用 Scala 实现了一下,尽量的保持接口和python库的一致,也方便从python移植相关的代码到 Scala 。
于是就有了这个 Graphviz4S
1、简单例子
1.1、简单图例
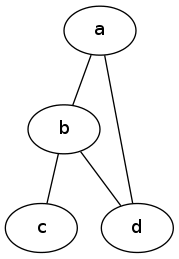
首先来看第一个例子,Scala代码如下:
    import com.liangdp.graphviz4s.Graph
    val dot = new Graph(name = "graphname")
    dot.edges(Array(
      ("a", "b"),
      ("b", "c"),
      ("b", "d"),
      ("d", "a")
    ))

    println(dot.source())
//    graph graphname {
//    		a -- b
//    		b -- c
//    		b -- d
//    		d -- a
//    }

    dot.render(fileName = "graphname.gv", directory = ".", view = true)
生成的结果如下:
1.2、简单图例2
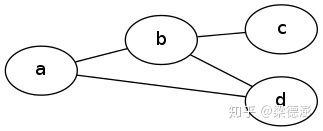
第二个例子和上面的一样,但是布局不同,Scala代码如下:
    import com.liangdp.graphviz4s.Graph
    val dot = new Graph(name = "graphname")

    dot.body += "\t\trankdir=LR  //Rank Direction Left to Right"
    dot.edges(Array(
      ("a", "b"),
      ("b", "c"),
      ("b", "d"),
      ("d", "a")
    ))

    println(dot.source())
//    graph graphname {
//    		rankdir=LR  //Rank Direction Left to Right
//    		a -- b
//    		b -- c
//    		b -- d
//    		d -- a
//    }

    dot.render(fileName = "graphname.gv", directory = ".", view = true)
生成的结果如下:
1.3、简单有向图
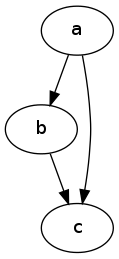
第三个例子是一个简单的有向图,Scala代码如下:
    import com.liangdp.graphviz4s.Digraph
    val dot = new Digraph(name = "graphname")

    dot.edges(Array(
      ("a", "b"),
      ("b", "c"),
      ("a", "c")
    ))

    println(dot.source())
//    digraph graphname {
//    		a -> b
//    		b -> c
//    		a -> c
//    }

    dot.render(fileName = "graphname.gv", directory = ".", view = true)
生成的结果如下:
1.4、带标签的简单有向图
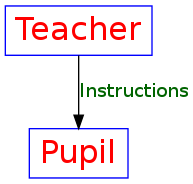
第四个例子给有向图的边加上标签,对应的Scala代码如下:
    import com.liangdp.graphviz4s.Digraph
    val dot = new Digraph(name = "graphname")

    dot.node(name = "T", label = "Teacher")
    dot.node(name = "P", label = "Pupil")

    import scala.collection.mutable.Map
    dot.edge(tailName = "T", headName = "P", label = "Instructions",
        attrs = Map("fontcolor" -> "darkgreen"))

    println(dot.source())
//    digraph graphname {
//    	"T" [label="Teacher" ]
//    	"P" [label="Pupil" ]
//    		T -> P [label="Instructions"  fontcolor=darkgreen]
//    }

    dot.render(fileName = "graphname.gv", directory = ".", view = true)
生成的结果如下:
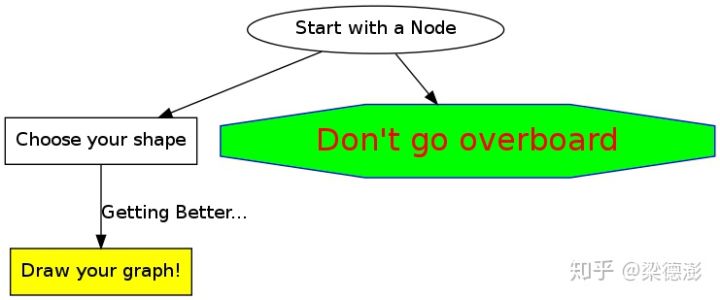
1.5、总结
Scala代码:
    import com.liangdp.graphviz4s.Digraph
    val dot = new Digraph(name = "summary")

    dot.node(name = "start", label = "Start with a Node")
    import scala.collection.mutable.Map
    dot.node(name = "next", label = "Choose your shape", attrs = Map("shape" -> "box"))
    dot.node(name = "warning", label = "Don't go overboard",
        attrs = Map("color" -> "Blue", "fontcolor" -> "Red", "fontsize" -> "24",
            "style" -> "filled", "fillcolor" -> "green", "shape" -> "octagon"))
    dot.node(name = "end", label = "Draw your graph!",
        attrs = Map("shape" -> "box", "style" -> "filled", "fillcolor" -> "yellow"))

    dot.edge(tailName = "start", headName = "next")
    dot.edge(tailName = "start", headName = "warning")
    dot.edge(tailName = "next", headName = "end", label = "Getting Better...")

    println(dot.source())
//    digraph summary {
//    	"start" [label="Start with a Node" ]
//    	"next" [label="Choose your shape"  shape=box]
//    	"warning" [label="Don't go overboard"  fontsize=24 color=Blue fillcolor=green shape=octagon fontcolor=Red style=filled]
//    	"end" [label="Draw your graph!"  fillcolor=yellow shape=box style=filled]
//    		start -> next []
//    		start -> warning []
//    		next -> end [label="Getting Better..." ]
//    }

    dot.render(fileName = "graphname.gv", directory = ".", view = true)
生成的结果如下:
2、高级例子
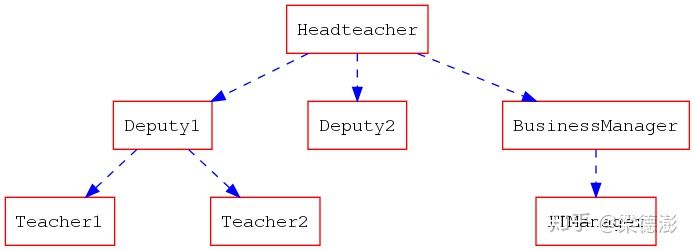
2.1、少写一点代码
单独地去定义每一个节点的属性很浪费时间,下面这个技巧能够让你coding的速度快一点。
Scala代码如下:
    import com.liangdp.graphviz4s.Digraph
    val dot = new Digraph(name = "hierarchy")

    // increases the separation between nodes
    dot.body += "\tnodesep=1.0"
    import scala.collection.mutable.Map
    //All nodes will this shape and colour
    dot.attr("node", attrs =
      Map("color" -> "Red", "fontname" -> "Courier", "shape" -> "box"))
    //All the lines look like this
    dot.attr("edge", attrs = Map("color" -> "Blue", "style" -> "dashed"))

    dot.edges("Headteacher", Array("Deputy1", "Deputy2", "BusinessManager"))
    dot.edges("Deputy1", Array("Teacher1", "Teacher2"))
    dot.edge("BusinessManager", "ITManager")
    // Put them on the same level
    dot.body += "\t{rank=same;ITManager Teacher1 Teacher2}"

    println(dot.source())
//    digraph hierarchy {
//    	nodesep=1.0
//    	node [ fontname=Courier color=Red shape=box]
//    	edge [ color=Blue style=dashed]
//    		Headteacher -> Deputy1
//    		Headteacher -> Deputy2
//    		Headteacher -> BusinessManager
//    		Deputy1 -> Teacher1
//    		Deputy1 -> Teacher2
//    		BusinessManager -> ITManager []
//    	{rank=same;ITManager Teacher1 Teacher2}
//    }

    dot.render(fileName = "graphname.gv", directory = ".", view = true)
结果如下:
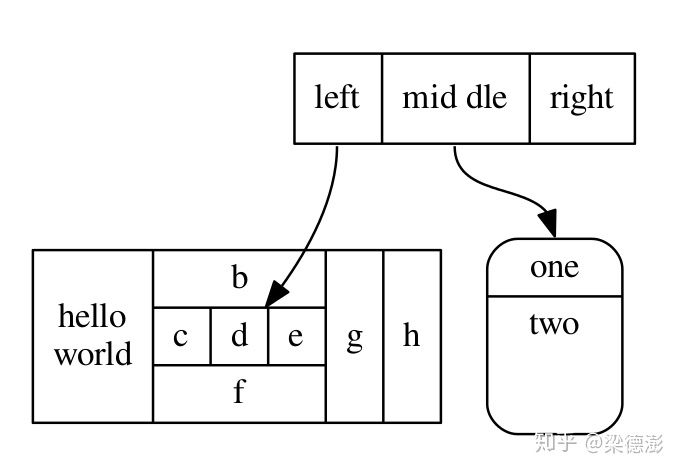
2.2、html
Scala代码如下:
    import com.liangdp.graphviz4s.Digraph
    val dot = new Digraph(name = "structs")

    import scala.collection.mutable.Map
    dot.attr("node", attrs = Map("shape" -> "record"))
    dot.node("struct1", label = """"<f0> left|<f1> mid\ dle|<f2> right"""")
    dot.node("struct2", label = """"{<f0> one|<f1> two\n\n\n}"""",
        attrs = Map("shape" -> "Mrecord"))
    dot.node("struct3", label = """"hello\nworld |{ b |{c|<here> d|e}| f}| g | h"""")

    dot.edge("struct1:f1", "struct2:f0")
    dot.edge("struct1:f0", "struct3:here")

    println(dot.source())
//    digraph structs {
//    	node [ shape=record]
//    	"struct1" [label="<f0> left|<f1> mid\ dle|<f2> right" ]
//    	"struct2" [label="{<f0> one|<f1> two\n\n\n}"  shape=Mrecord]
//    	"struct3" [label="hello\nworld |{ b |{c|<here> d|e}| f}| g | h" ]
//    		struct1:f1 -> struct2:f0 []
//    		struct1:f0 -> struct3:here []
//    }

    dot.render(fileName = "graphname.gv", directory = ".", view = true)
结果如下:
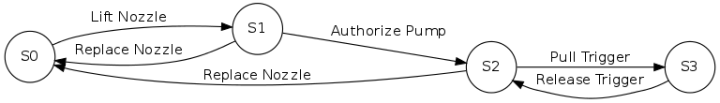
2.3、有限状态机
Scala代码如下:
    import com.liangdp.graphviz4s.Digraph
    val dot = new Digraph(name = "structs")

    dot.body += "\trankdir=LR"
    dot.body += s"""${"\t"}size="8,5""""

    import scala.collection.mutable.Map
    dot.attr("node", attrs = Map("shape" -> "circle"))
    dot.edge(tailName = "S0", headName = "S1", label = """"Lift Nozzle"""")
    dot.edge(tailName = "S1", headName = "S0", label = """"Replace Nozzle"""")
    dot.edge(tailName = "S1", headName = "S2", label = """"Authorize Pump"""")
    dot.edge(tailName = "S2", headName = "S0", label = """"Replace Nozzle"""")
    dot.edge(tailName = "S2", headName = "S3", label = """"Pull Trigger"""")
    dot.edge(tailName = "S3", headName = "S2", label = """"Release Trigger"""")

    println(dot.source())
//    digraph structs {
//    	rankdir=LR
//    	size="8,5"
//    	node [ shape=circle]
//    		S0 -> S1 [label="Lift Nozzle" ]
//    		S1 -> S0 [label="Replace Nozzle" ]
//    		S1 -> S2 [label="Authorize Pump" ]
//    		S2 -> S0 [label="Replace Nozzle" ]
//    		S2 -> S3 [label="Pull Trigger" ]
//    		S3 -> S2 [label="Release Trigger" ]
//    }

    dot.render(fileName = "graphname.gv", directory = ".", view = true)
结果如下:
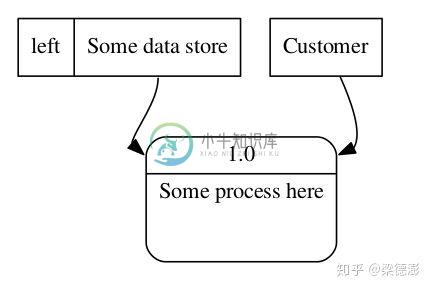
2.4、数据流示意图
Scala代码如下:
    import com.liangdp.graphviz4s.Digraph
    val dot = new Digraph(name = "dfd")

    import scala.collection.mutable.Map
    dot.attr("node", attrs = Map("shape" -> "record"))
    dot.node("store1", label = """"<f0> left|<f1> Some data store"""")
    dot.node("proc1", label = """"{<f0> 1.0|<f1> Some process here\n\n\n}"""",
        attrs = Map("shape" -> "Mrecord"))
    dot.node("enti1", label = "Customer",
        attrs = Map("shape" -> "box"))

    dot.edge(tailName = "store1:f1", headName = "proc1:f0")
    dot.edge(tailName = "enti1", headName = "proc1:f0")

    println(dot.source())
//    digraph dfd {
//    	node [ shape=record]
//    	"store1" [label="<f0> left|<f1> Some data store" ]
//    	"proc1" [label="{<f0> 1.0|<f1> Some process here\n\n\n}"  shape=Mrecord]
//    	"enti1" [label="Customer"  shape=box]
//    		store1:f1 -> proc1:f0 []
//    		enti1 -> proc1:f0 []
//    }

    dot.render(fileName = "graphname.gv", directory = ".", view = true)
结果如下:
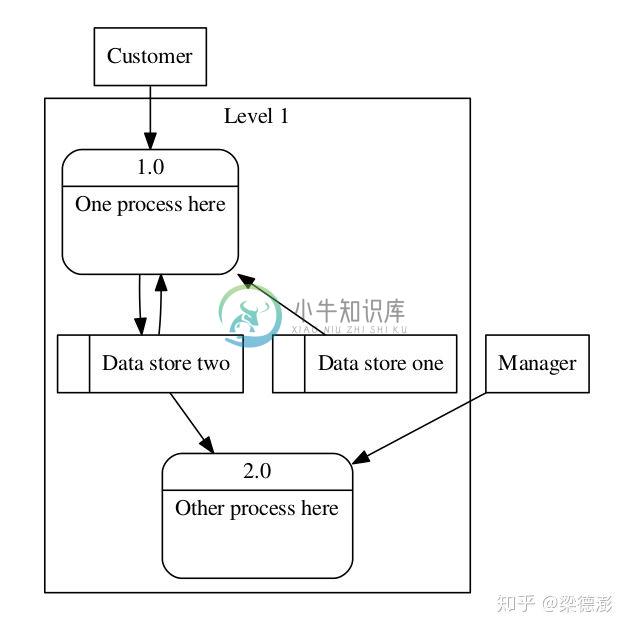
2.5、数据流示意图2
Scala代码如下:
    import com.liangdp.graphviz4s.Digraph
    val dot = new Digraph(name = "dfd2")

    import scala.collection.mutable.Map
    dot.attr("node", attrs = Map("shape" -> "record"))

    val subgraph0 = new Digraph(name = "level0")
    subgraph0.node("enti1", label = "Customer", Map("shape" -> "box"))
    subgraph0.node("enti2", label = "Manager", Map("shape" -> "box"))

    val subgraph1 = new Digraph(name = "cluster_level1")
    subgraph1.body += s"""${"\t"}label ="Level 1""""
    subgraph1.node("proc1", label = """"{<f0> 1.0|<f1> One process here\n\n\n}"""",
        attrs = Map("shape" -> "Mrecord"))
    subgraph1.node("proc2", label = """"{<f0> 2.0|<f1> Other process here\n\n\n}"""",
        attrs = Map("shape" -> "Mrecord"))
    subgraph1.node("store1", label = """"<f0>    |<f1> Data store one"""")
    subgraph1.node("store2", label = """"<f0>   |<f1> Data store two"""")
    subgraph1.body += "\t{rank=same; store1, store2}"

    dot.subGraph(subgraph0)
    dot.subGraph(subgraph1)

    dot.edge("enti1", "proc1")
    dot.edge("enti2", "proc2")
    dot.edge("store1", "proc1")
    dot.edge("store2", "proc2")
    dot.edge("proc1", "store2")
    dot.edge("store2", "proc1")

    println(dot.source())
//    digraph dfd2 {
//    	node [ shape=record]
//    	subgraph level0 {
//    		"enti1" [label="Customer"  shape=box]
//    		"enti2" [label="Manager"  shape=box]
//    	}
//    	subgraph cluster_level1 {
//    		label ="Level 1"
//    		"proc1" [label="{<f0> 1.0|<f1> One process here\n\n\n}"  shape=Mrecord]
//    		"proc2" [label="{<f0> 2.0|<f1> Other process here\n\n\n}"  shape=Mrecord]
//    		"store1" [label="<f0>    |<f1> Data store one" ]
//    		"store2" [label="<f0>   |<f1> Data store two" ]
//    		{rank=same; store1, store2}
//    	}
//    		enti1 -> proc1 []
//    		enti2 -> proc2 []
//    		store1 -> proc1 []
//    		store2 -> proc2 []
//    		proc1 -> store2 []
//    		store2 -> proc1 []
//    }

    dot.render(fileName = "graphname.gv", directory = ".", view = true)
结果如下:
2.6、对象继承
Scala代码如下:
    import com.liangdp.graphviz4s.Digraph
    val dot = new Digraph(name = "obj")

    import scala.collection.mutable.Map
    dot.attr("node", attrs = Map("shape" -> "record"))

    dot.body += s"""${"\t"}rankdir="BT""""

    dot.node("teacher", label = """"{<f0> Teacher|<f1> \n  |<f2> \n   }"""")
    dot.node("course", label = """"{<f0> Course|<f1> \n  |<f2> \n   }"""")
    dot.node("student", label = """"{<f0> Student|<f1> \n  |<f2> \n   }"""")
    dot.node("lesson", label = """"{<f0> Lesson |<f1> \n  |<f2> \n   }"""")
    dot.node("tutorial", label = """"{<f0> Tutorial|<f1> \n  |<f2> \n   }"""")
    dot.node("assessment", label = """"{<f0> Assessment|<f1> \n  |<f2> \n   }"""")
    dot.node("coursework", label = """"{<f0> Coursework|<f1> \n  |<f2> \n   }"""")
    dot.node("exam", label = """"{<f0> Exam|<f1> \n  |<f2> \n   }"""")

    dot.body += "\t{rank=same; teacher course student}"

    dot.edge("teacher", "course", attrs = Map("dir" -> "forward", "arrowhead" -> "none",
        "arrowtail" -> "normal", "headlabel" -> """"1"""", "taillabel" -> """"1..""""))
    dot.edge("student", "course", attrs = Map("dir" -> "forward", "arrowhead" -> "none",
        "arrowtail" -> "normal", "headlabel" -> """"1"""", "taillabel" -> """"1..""""))
    dot.edge("lesson", "course", attrs = Map("dir" -> "forward", "arrowhead" -> "diamond",
        "arrowtail" -> "normal"))
    dot.edge("tutorial", "course", attrs = Map("dir" -> "forward", "arrowhead" -> "diamond",
        "arrowtail" -> "normal"))
    dot.edge("assessment", "course", attrs = Map("dir" -> "forward", "arrowhead" -> "diamond",
        "arrowtail" -> "normal"))
    dot.edge("coursework", "assessment")
    dot.edge("exam", "assessment")

    println(dot.source())
//    digraph obj {
//    	node [ shape=record]
//    	rankdir="BT"
//    	"teacher" [label="{<f0> Teacher|<f1> \n  |<f2> \n   }" ]
//    	"course" [label="{<f0> Course|<f1> \n  |<f2> \n   }" ]
//    	"student" [label="{<f0> Student|<f1> \n  |<f2> \n   }" ]
//    	"lesson" [label="{<f0> Lesson |<f1> \n  |<f2> \n   }" ]
//    	"tutorial" [label="{<f0> Tutorial|<f1> \n  |<f2> \n   }" ]
//    	"assessment" [label="{<f0> Assessment|<f1> \n  |<f2> \n   }" ]
//    	"coursework" [label="{<f0> Coursework|<f1> \n  |<f2> \n   }" ]
//    	"exam" [label="{<f0> Exam|<f1> \n  |<f2> \n   }" ]
//    	{rank=same; teacher course student}
//    		teacher -> course [ arrowtail=normal dir=forward taillabel="1.." arrowhead=none headlabel="1"]
//    		student -> course [ arrowtail=normal dir=forward taillabel="1.." arrowhead=none headlabel="1"]
//    		lesson -> course [ arrowtail=normal dir=forward arrowhead=diamond]
//    		tutorial -> course [ arrowtail=normal dir=forward arrowhead=diamond]
//    		assessment -> course [ arrowtail=normal dir=forward arrowhead=diamond]
//    		coursework -> assessment []
//    		exam -> assessment []
//    }

    dot.render(fileName = "graphname.gv", directory = ".", view = true)
结果如下:

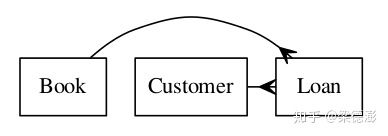
2.7、关系型实体
Scala代码如下:
    import com.liangdp.graphviz4s.Digraph
    val dot = new Digraph(name = "ER")

    import scala.collection.mutable.Map
    dot.attr("node", attrs = Map("shape" -> "box"))

    dot.node("Book")
    dot.node("Customer")
    dot.node("Loan")

    dot.body += "\t{rank=same;Book,Customer,Loan}"

    dot.edge("Book", "Loan", attrs = Map("dir" -> "forward",
        "arrowhead" -> "crow", "arrowtail" -> "normal"))
    dot.edge("Customer", "Loan", attrs = Map("dir" -> "forward",
        "arrowhead" -> "crow", "arrowtail" -> "normal"))

    println(dot.source())
//    digraph ER {
//    	node [ shape=box]
//    	"Book" []
//    	"Customer" []
//    	"Loan" []
//    	{rank=same;Book,Customer,Loan}
//    		Book -> Loan [ arrowtail=normal dir=forward arrowhead=crow]
//    		Customer -> Loan [ arrowtail=normal dir=forward arrowhead=crow]
//    }

    dot.render(fileName = "graphname.gv", directory = ".", view = true)
结果:
通过以上例子的介绍,相信读者都能够了解如何使用这个小工具了,不过这个小工具还有很多
需要完善的地方,也欢迎感兴趣的朋友一起来完善它。
-
Photoshop 提供多种钢笔工具以满足您的使用案例和创意样式: 通过弯度钢笔工具,可以直观地绘制曲线和直线段。 标准钢笔工具可用于精确绘制直线段和曲线。 自由钢笔工具可用于绘制路径,就像用铅笔在纸上绘图一样。 磁性钢笔选项可用于绘制与图像中定义的区域边缘对齐的路径。 使用 Shift+ P 组合键可循环切换钢笔组中的工具。 使用 Shift+P 组合键可循环切换钢笔工具 可以组合使用钢笔工具和
-
更改画笔大小和钢笔压力的不透明度 如果您使用图形绘制绘图板(例如 Wacom® 绘图板),则可以通过钢笔压力、角度、旋转或光笔轮来控制绘画工具。 选择“画笔”、“铅笔” 或其他绘画工具。 在选项栏中,执行下列某个操作: 单击“绘图板压力控制大小”按钮。 单击“绘图板压力控制不透明度”按钮。 注意:选取“窗口”>“画笔”可访问根据钢笔压力而改变角度、流量、散布程度、纹理深度以及描边圆度的其他控制选项
-
使用铅笔工具绘图 铅笔工具在 Adobe Illustrator 和 InDesign 中的工作方式大致相同。它可用于绘制开放路径和闭合路径,就像用铅笔在纸上绘图一样。这对于快速素描或创建手绘外观最有用。绘制路径后,如有需要您可以立刻更改。 当您使用 “铅笔 ”工具绘制时锚点已设置;您不决定它们所在位置。但是,当路径完成后您可以调整它们。设置的锚点数量由路径的长度和复杂程度以及 “铅笔工具首选项
-
本文向大家介绍Go语言中使用gorm小结,包括了Go语言中使用gorm小结的使用技巧和注意事项,需要的朋友参考一下 首先说明的是,在项目中使用orm的好处很多: 防止直接拼接sql语句引入sql注入漏洞 方便对modle进行统一管理 专注业务,加速开发 坏处也是显而易见的: 开发者与最终的sql语句隔了一层orm,因此可能会不慎引入烂sql 依赖于orm的成熟度,无法进行一些「复杂」的查询。当然,
-
画布定位 先看这张图: > x <- c(1,2,3) > y <- c(1,3,4) > data <- data.frame(x,y) > ggplot(data, aes(x = x, y = y)) + geom_point() 如果我们希望让画布再大一些,让这三个点集中一些怎么办?我们可以调整画布的坐标范围,以下两种方法效果是一样的: > ggplot(data, aes(x = x
-
我不熟悉MongoDB和Scala语言 我正在使用scala语言在本地连接mongodb 我正在使用下面的依赖项 // https://mvnrepository.com/artifact/org.mongodb.scala/mongo-scala-driver libraryDependencies=“org.mongodb.scala”%%“mongo scala驱动程序”%%“4.2.3”