
Python绘制股票移动均线的实例

1. 前沿
移动均线是股票最进本的指标,本文采用numpy.convolve计算股票的移动均线
2. numpy.convolve
numpy.convolve(a, v, mode='full')
Returns the discrete, linear convolution of two one-dimensional sequences.
The convolution operator is often seen in signal processing, where it models the effect of a linear time-invariant system on a signal [R17]. In probability theory, the sum of two independent random variables is distributed according to the convolution of their individual distributions.
If v is longer than a, the arrays are swapped before computation.
Parameters:
a : (N,) array_like

 First one-dimensional input array.

 v : (M,) array_like

 Second one-dimensional input array.

 mode : {‘full', ‘valid', ‘same'}, optional

 ‘full':

  By default, mode is ‘full'. This returns the convolution at each point of overlap, with an output shape of (N+M-1,). At the end-points of the convolution, the signals do not overlap completely, and boundary effects may be seen.
 ‘same':

  Mode same returns output of length max(M, N). Boundary effects are still visible.
 ‘valid':

  Mode valid returns output of length max(M, N) - min(M, N) + 1. The convolution product is only given for points where the signals overlap completely. Values outside the signal boundary have no effect.
Returns:
out : ndarray

 Discrete, linear convolution of a and v.
计算公式:
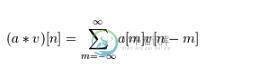
eg:
>>> import numpy as np
>>>
>>> np_list = np.array([1, 2, 3, 4, 5, 6, 7, 8, 9])
>>>
>>> np_list
array([1, 2, 3, 4, 5, 6, 7, 8, 9])
>>> x = np.convolve(np_list, 2)
>>> x
array([ 2, 4, 6, 8, 10, 12, 14, 16, 18])
>>> x = np.convolve(np_list, [0.5, 0.5])
>>> x
array([ 0.5, 1.5, 2.5, 3.5, 4.5, 5.5, 6.5, 7.5, 8.5, 4.5])
3. 移动均线计算
def moving_average(x, n, type='simple'):
 x = np.asarray(x)
 if type == 'simple':
  weights = np.ones(n)
 else:
  weights = np.exp(np.linspace(-1., 0., n))

 weights /= weights.sum()

 a = np.convolve(x, weights, mode='full')[:len(x)]
 a[:n] = a[n]
 return a
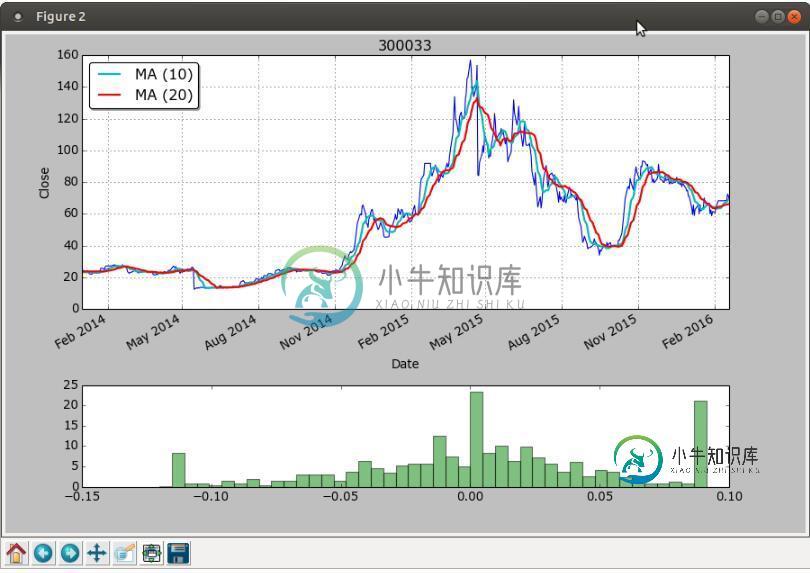
 ma10 = moving_average(close_data, 10, 'simple')
 ma20 = moving_average(close_data, 20, 'simple')

 ax1.plot(data['date'], ma10, color='c', lw=2, label='MA (10)')
 ax1.plot(data['date'], ma20, color='red', lw=2, label='MA (20)')
4. 效果图
以上这篇Python绘制股票移动均线的实例就是小编分享给大家的全部内容了,希望能给大家一个参考,也希望大家多多支持小牛知识库。
-
我想让我的应用程序中的编辑文本行成为自定义颜色,所以我使用了一个可绘制线条的xml,并将其设置为我的编辑文本背景,即如何在EditText中更改线条颜色。 问题是我画的线现在表现为删除线,而不是出现在编辑文本的底部。有没有办法把它们移下来? 尝试设置Android:重力编辑文本和绘图。 http://i.stack.imgur.com/ncl9H.png
-
本文向大家介绍使用PyQtGraph绘制精美的股票行情K线图的示例代码,包括了使用PyQtGraph绘制精美的股票行情K线图的示例代码的使用技巧和注意事项,需要的朋友参考一下 pyqtgraph是Python平台上一种功能强大的2D/3D绘图库,相对于matplotlib库,由于其在内部实现方式上,使用了高速计算的numpy信号处理库以及Qt的GraphicsView框架,因此它在大数据量的处理及
-
有办法限制Android应用程序中的共享选项吗?我尝试过使用,或者只是使用
-
所以我在上面创建了这个表格,现在我试图用它来绘制 但是现在我想弄清楚如何画一条均值线,例如,我在图像的右边画了爱尔兰的均值,我不知道如何在这个均值的图表上画一条线。真的,任何帮助感谢。干杯,伙计们。
-
本文向大家介绍python用线性回归预测股票价格的实现代码,包括了python用线性回归预测股票价格的实现代码的使用技巧和注意事项,需要的朋友参考一下 线性回归在整个财务中广泛应用于众多应用程序中。在之前的教程中,我们使用普通最小二乘法(OLS)计算了公司的beta与相对索引的比较。现在,我们将使用线性回归来估计股票价格。 线性回归是一种用于模拟因变量(y)和自变量(x)之间关系的方法。通过简单的
-
问题内容: 我正在为Pyspark中的时间序列编写异常检测算法。我想计算(-3,3)或(-4,4)窗口的加权移动平均值。现在,我正在使用滞后和超前窗口功能,并将它们乘以一组权重。我的窗口当前是(-2,2)。 我想知道是否有另一种方法可以计算Pyspark中的加权移动平均值。 我正在使用的当前代码是: 问题答案: 您可以概括当前的代码: 它可以用作: 注意事项 : 您可能会考虑将滞后缺失的帧的结果标