Android版的股票行情K线图开发
现在在手上的是一个证券资讯类型的app,其中有涉及到股票行情界面,行情中有K线图等,看到网上很多人在求这方面的资料,所以我特地写了一个demo在此处给大家分享一下。
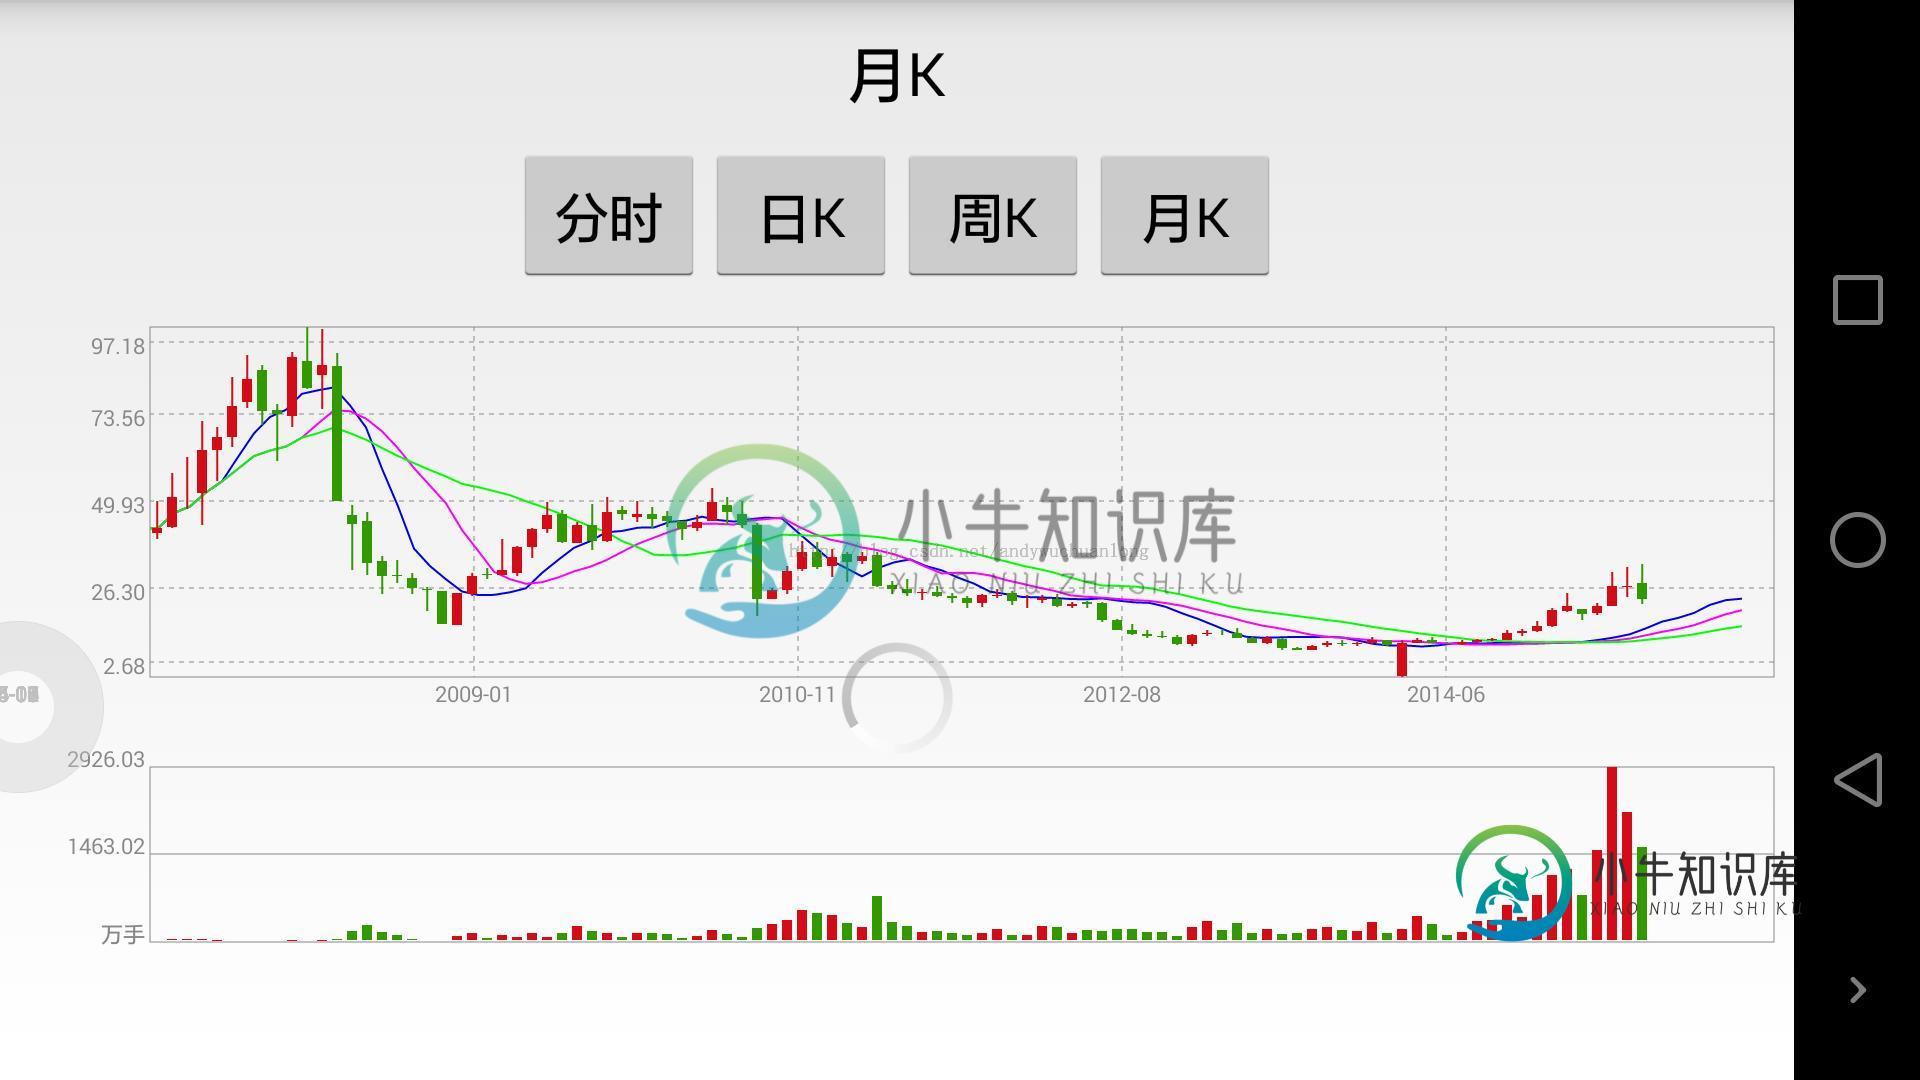
下面是做出来的效果图:

背景图是利用canvas先画出一个矩形,然后再画几根虚线,均线图是通过path来绘制的,总之图的绘制是很简单的,我就不在这里作介绍了,大家可以去github下载源码看看。涉及到均线、最高价、最低价、收盘价、开盘价的概念大家可以百度一下。
我再这里要介绍的是计算问题:
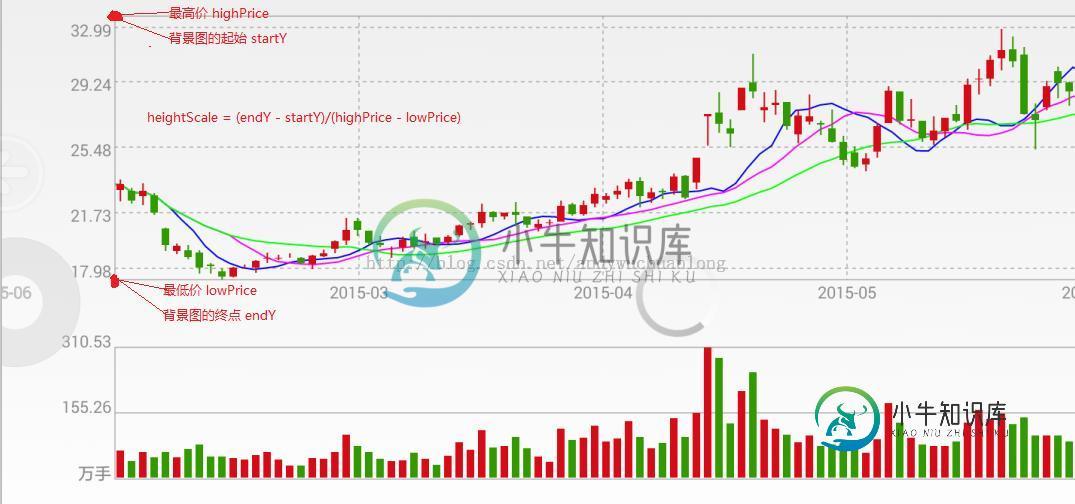
大家可以看到分时图、日K、月K的左边的成交价格都是不一样的,而我们的k线都是通过这个价格来绘制的,也就是说价格是时刻变动,那么我们的k线绘制也是变动的。假设我们要计算分时图中价格为25.69的那一分钟应该如何画,画在屏幕中的哪一个位置,那么这个应该怎么画呢,价格是变动的,画的位置也是变动的,但是有一点我们屏幕的大小是不变的。所以我们可以通过背景图的高度来计算某个价格的线图应该从哪个地方开始画。我们可以计算出一个像素点对应多少个价格,分析图如下:

价格和像素形成个一个比例计算是:double heightScale = (endY - startY)/(highPrice - lowPrice);
所以价格25.69应该是画在mStartY = (float) (startY+ (highPrice - 25.69) * heightScale);
这个明白了之后其他的原理都是一样的,我就不介绍了,下面是部分代码:
@Override
  protected void drawKChatBackGround() {
    Rect dirty = new Rect(left, kChartTop, right, KChartbottom);
    // 画背景图的矩形
    mCanvas.drawRect(dirty, LineGrayPaint);
    PathEffect effects = new DashPathEffect(new float[] { 5, 5, 5, 5 }, 1);
    LineGrayPaint.setPathEffect(effects);
    Path path = new Path();
    int y = kChartTop + 15;
    // 画上面的虚线
    path.moveTo(left, y );
    path.lineTo(right, y );
    String text = getPriceText(highPrice);
    int textHeight = (int) (textGrayPaint.descent() - textGrayPaint.ascent());
    mCanvas.drawText(text,left - textGrayPaint.measureText(text) - 5,y + textHeight/2 ,textGrayPaint);
    double max = highPrice - lowPrice;
    if (max > 10){
      // 分成四等分
      // 画中间的三根虚线
      int n = 4;
      double sper = (highPrice - lowPrice) / 4;// 每一等分代表的价格
      for(int i=1;i<n;i++){
        y = i*((KChartbottom - kChartTop)/n) + kChartTop;
        path.moveTo(left, y);
        path.lineTo(right,y);
        text = getPriceText(highPrice - i*sper);
        mCanvas.drawText(text,left - textGrayPaint.measureText(text) - 5,y + textHeight/2,textGrayPaint);
      }
    }else{
      // 分成两等分
      // 画中间的虚线
      y = (KChartbottom - kChartTop)/2 + kChartTop;
      path.moveTo(left, y);
      path.lineTo(right, y);
      text = getPriceText(highPrice - (highPrice - lowPrice) / 2);
      mCanvas.drawText(text,left - textGrayPaint.measureText(text) - 5,y + textHeight/2,textGrayPaint);
    }
    // 画下面的虚线
    y = KChartbottom - 15;
    path.moveTo(left, y);
    path.lineTo(right, y);
    text = getPriceText(lowPrice);
    mCanvas.drawText(text,left - textGrayPaint.measureText(text) - 5,y + textHeight/2,textGrayPaint);
//   // 画等分的虚线和下面的日期
    for (int i = num - 1; i > 0; i--) {
      int x = left + perWidth * i;
      path.moveTo(x, kChartTop);
      path.lineTo(x, KChartbottom);
      perXPoint[i - 1] = x;
    }
    mCanvas.drawPath(path, LineGrayPaint);
  }
@Override
  protected void drawMAChart() {
    // 画均线
    Path path5 = new Path();
    Path path10 = new Path();
    Path path20 = new Path();
    double heightScale = (KChartbottom - kChartTop)/(highPrice - lowPrice);
    int maStart = left;
    float maStartY;
    path5.moveTo(maStart, (float) (kChartTop + (highPrice - infos.get(0).getMaValue5()) * heightScale));
    path10.moveTo(maStart, (float) (kChartTop + (highPrice - infos.get(0).getMaValue10()) * heightScale));
    path20.moveTo(maStart, (float) (kChartTop + (highPrice - infos.get(0).getMaValue20()) * heightScale));

    for(SingleStockInfo info:infos){
      maStart += per * perHalf;// 每一天实际所占的数据是4/6,左右边距各1/6
      maStartY = (float) (kChartTop + (highPrice - info.getMaValue5()) * heightScale);
      path5.lineTo(maStart, maStartY);
      maStartY = (float) (kChartTop + (highPrice - info.getMaValue10()) * heightScale);
      path10.lineTo(maStart, maStartY);
      maStartY = (float) (kChartTop + (highPrice - info.getMaValue20()) * heightScale);
      path20.lineTo(maStart, maStartY);
      maStart += per * perHalf;
    }

    Paint paint = new Paint();
    paint.setColor(Color.BLUE);
    paint.setAntiAlias(true);
    paint.setStrokeWidth(2);
    paint.setStyle(Style.STROKE);
    mCanvas.drawPath(path5, paint);
    paint.setColor(Color.MAGENTA);
    mCanvas.drawPath(path10, paint);
    paint.setColor(Color.GREEN);
    mCanvas.drawPath(path20, paint);
  }
/**
   * 下面的柱形图
   */
  @Override
  protected void drawPillarsChart(int flag) {
    LineGrayPaint.setPathEffect(null);
    Rect dirty = new Rect(left, pillarsChartTop, right, pillarsChartbottom);
    // 画背景图的矩形
    mCanvas.drawRect(dirty, LineGrayPaint);

    int y = pillarsChartTop + (pillarsChartbottom - pillarsChartTop)/2;
    mCanvas.drawLine(left,y,right, y, LineGrayPaint);

    // 中间的值
    String totalCount = getPriceText(maxCount/2/10000);
    float maginLeft = left - textGrayPaint.measureText(totalCount)- 5;
    mCanvas.drawText(totalCount, maginLeft, y,textGrayPaint);
    // 上面的值
    totalCount = getPriceText(maxCount/10000);
    maginLeft = left - textGrayPaint.measureText(totalCount)- 5;
    mCanvas.drawText(totalCount, maginLeft, pillarsChartTop,textGrayPaint);
    // 下面的值
    totalCount = "万手";
    maginLeft = left - textGrayPaint.measureText(totalCount) - 5;
    mCanvas.drawText(totalCount, maginLeft, pillarsChartbottom,textGrayPaint);
    int pStart = left;
    float pStartY;
    double heightScale = (pillarsChartbottom - pillarsChartTop)/maxCount;
    Paint paint = new Paint();
    paint.setAntiAlias(true);
    paint.setStyle(Paint.Style.FILL);
    if (flag == StockService.FLAG){
      for(MinuteInfo info:minuteInfos){
        pStart += per * per16;// 每一天实际所占的数据是4/6,加上1/6
        pStartY = (float) (pillarsChartTop + (maxCount - info.getVolume()) * heightScale);
        dirty = new Rect(pStart, (int) pStartY, (int) (pStart + per * per46), pillarsChartbottom-2);
        paint.setColor(info.getColor());
        // 画背景图的矩形
        mCanvas.drawRect(dirty, paint);
        pStart += per * per56;// 右边的间距 5/6
      }
    }else{
      for(SingleStockInfo info:infos){
        pStart += per * per16;// 每一天实际所占的数据是4/6,加上1/6
        pStartY = (float) (pillarsChartTop + (maxCount - info.getTotalCount()) * heightScale);
        dirty = new Rect(pStart, (int) pStartY, (int) (pStart + per * per46), pillarsChartbottom-2);
        paint.setColor(info.getColor());
        // 画背景图的矩形
        mCanvas.drawRect(dirty, paint);
        pStart += per * per56;// 右边的间距 5/6
      }
    }
  }
/**
   * 分时图
   */
  @Override
  public void drawHoursChart(){
    double heightScale = (KChartbottom - kChartTop)/(highPrice - lowPrice);
    int cLeft = left;
    int cTop = 0;
    Path path = new Path();
    path.moveTo(cLeft, KChartbottom-2);
    int position = 0;
    int perPointX = perXPoint[position];// 记录第一条垂直虚线的x坐标
    for(MinuteInfo info:minuteInfos){
      cLeft += per * per16;
      cTop = (int) (kChartTop + (highPrice - info.getNow()) * heightScale);
      path.lineTo(cLeft + per * per26, cTop);
      if (cLeft >= perPointX){
        // 恰好画到第一条垂直虚线的地方,需要画下面的时间
        String text = KChartUtil.getMinute(info.getMinute());
        float textWidth = textGrayPaint.measureText(text);
        int textHeight = (int) (textGrayPaint.descent()- textGrayPaint.ascent());
        mCanvas.drawText(text, perPointX - textWidth/2, KChartbottom + textHeight, textGrayPaint);
        if (!(position == perXPoint.length-1)){
          Log.e(TAG, perPointX+"----------"+info.getMinute()+"---"+text);
          perPointX = perXPoint[++position];
        }
      }
      cLeft += per * per56;// 右边的间距 5/6
    }
    path.lineTo(cLeft, KChartbottom-2);
    Paint LinePaint = new Paint();
    LinePaint.setColor(Color.BLUE);
    LinePaint.setAntiAlias(true);
    LinePaint.setStrokeWidth(1);
    LinePaint.setStyle(Style.STROKE);
//   LinePaint.setStyle(Style.STROKE);
    mCanvas.drawPath(path, LinePaint);
    LinePaint.setAlpha(50);
    LinePaint.setStyle(Style.FILL);
    mCanvas.drawPath(path, LinePaint);
  }
新年伊始,中国股市走出世界罕见,前无古人后无来者的极端行情,股市有风险,投资需谨慎。
这句话是题外话了,重点还是希望对大家学习Android程序设计有所帮助。
-
本文向大家介绍使用PyQtGraph绘制精美的股票行情K线图的示例代码,包括了使用PyQtGraph绘制精美的股票行情K线图的示例代码的使用技巧和注意事项,需要的朋友参考一下 pyqtgraph是Python平台上一种功能强大的2D/3D绘图库,相对于matplotlib库,由于其在内部实现方式上,使用了高速计算的numpy信号处理库以及Qt的GraphicsView框架,因此它在大数据量的处理及
-
问题内容: 如果我在一个自动收录器频道范围内通话并调用stop(),则该频道已停止但未关闭。 在此示例中: 运行产生: 因此,goroutine永远不会退出。有没有更好的方法来处理这种情况?我应该担心goroutine永远不会退出吗? 问题答案: 在第二个频道上发出“完成”信号,然后在代码行情清单和已完成的频道之间选择您的goroutine。 根据您真正想做的事情,可能存在更好的解决方案,但这很难
-
问题内容: 我想动态更改我的股票行情间隔。 我写下了一个例子来向您展示我的工作方式。我的用例不是“加速度计”,而是希望它能给您一个构想。 http://play.golang.org/p/6ANFnoE6pA 出问题的是,股票报价器总是每秒钟都在“滴答”,并且不会加速…有什么想法吗? 问题答案: 遵循对@fzerorubigd的回答,但更加完整。 如前所述,在 这种情况下我们无法使用,因为 循环会
-
问题内容: 我正在尝试开始一个偶数时间戳。基本上我想要的是这段代码: 要始终每隔5秒打印一次: 是否有一个优雅的解决方案? 问题答案: 您可以将股票行情显示的开始时间延迟到将近5秒钟: 或者使用Time方法获得正确延迟的另一种方法:
-
K线图(又称蜡烛图)表示的是每个周期的股价变化情况,包括开票价、最高价、最低价格和收盘价,形如下图 其中开盘价大于收盘价为涨,一般用红色表示,开盘价小于收盘价为跌,一般用绿色表示(红绿色是国内的习惯)。 K 线图的数据 蜡烛图中的每个数据点包含五个数据,分别是 时间戳, 开盘价, 最高价, 最低价, 收盘价,实例如下: data: [ [1147651200000, 67.37, 68.3
-
本文向大家介绍Python绘制股票移动均线的实例,包括了Python绘制股票移动均线的实例的使用技巧和注意事项,需要的朋友参考一下 1. 前沿 移动均线是股票最进本的指标,本文采用numpy.convolve计算股票的移动均线 2. numpy.convolve numpy.convolve(a, v, mode='full') Returns the discrete, linear convo

