问题:

openlayers - 使用OpenLayers根据经纬度及步长生成网格?
养焱
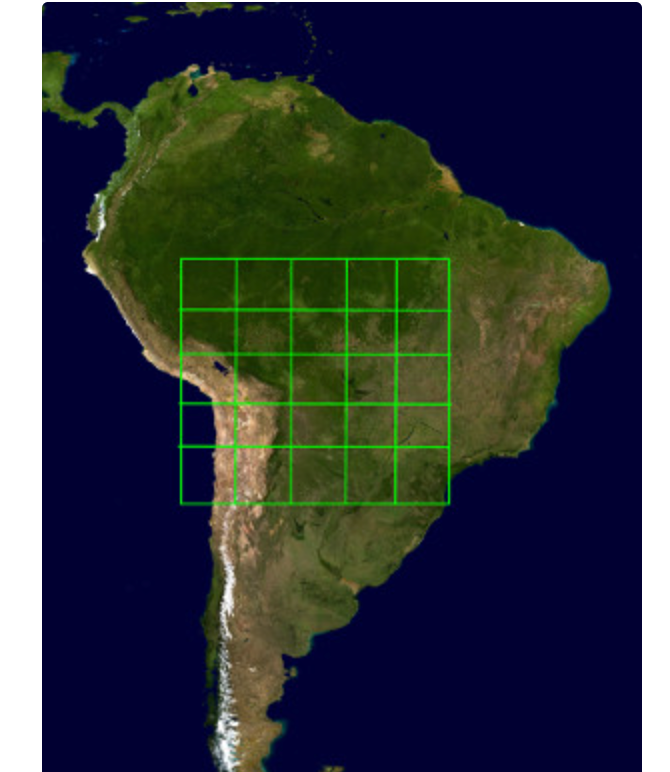
使用OpenLayers绘制简单网格?
像下面这样,求助
根据提供的经纬度 startPosition, endPosition, step 两个点的经纬度(生成的大网格对角线),和步长(一个正方形小网格的长度),计算生成网格,后面还想能鼠标框选多个小网格,设置框选的多个小网格处的数据信息
const generateGrid = (startPosition, endPosition, step) => {}共有1个答案
虞华翰
实现了
import "./style.css";import { Map, View, Feature } from "ol";import { Polygon } from "ol/geom";import { Select, DragBox } from "ol/interaction";import { never, always } from "ol/events/condition";import TileLayer from "ol/layer/Tile";import OSM from "ol/source/OSM";import { Vector as VectorSource } from "ol/source";import { Vector as VectorLayer } from "ol/layer";import { Fill, Style, Text, Stroke } from "ol/style";/** * 根据起始点、终止点和步长生成网格 * @param {Array<number>} startPosition - 左上角经纬度 [经度, 纬度] * @param {Array<number>} endPosition - 右下角经纬度 [经度, 纬度] * @param {number} lonStep - 经度步长 * @param {number} latStep - 纬度步长 * @returns {Array<Feature>} 生成的网格要素数组 */const generateGrid = (startPosition, endPosition, lonStep, latStep) => { const features = []; let idCounter = 1; // 用于给每个长方形赋予一个简单的数字ID,从1开始 for (let lon = startPosition[0]; lon < endPosition[0]; lon += lonStep) { for (let lat = startPosition[1]; lat > endPosition[1]; lat -= latStep) { const squareCoords = [ [ [lon, lat], [lon + lonStep, lat], [lon + lonStep, lat - latStep], [lon, lat - latStep], [lon, lat], // 闭合长方形 ], ]; const feature = new Feature({ geometry: new Polygon(squareCoords), name: idCounter.toString(), // 将ID转换为字符串作为name }); features.push(feature); idCounter++; // 更新ID计数器 } } return features;};// 使用 generateGrid 函数生成网格并创建 VectorLayerconst vectorSource = new VectorSource({ features: generateGrid([119.0, 29.2], [119.8, 28.2], 0.4, 0.2),});const vectorLayer = new VectorLayer({ source: vectorSource, style: function (feature) { // 同原始代码中的样式设置 return new Style({ stroke: new Stroke({ width: 4, color: "red", }), fill: new Fill({ color: "yellow", }), text: new Text({ font: "10px Microsoft YaHei", text: feature.get("name"), overflow: true, textAlign: "center", textBaseline: "middle", fill: new Fill({ color: "#0e84ba", }), offsetX: 0, }), }); },});// 创建地图const map = new Map({ target: "map", layers: [ new TileLayer({ source: new OSM(), }), ], view: new View({ projection: "EPSG:4326", center: [119.2, 29.2], zoom: 10, }),});map.addLayer(vectorLayer);// 创建选择工具,用于盛放矩形框内的要素const select = new Select({ condition: never, style: function (feature) { return new Style({ stroke: new Stroke({ width: 4, color: "red", }), fill: new Fill({ color: "green", }), text: new Text({ font: "10px Microsoft YaHei", text: "选中" + feature.get("name"), overflow: true, textAlign: "center", textBaseline: "middle", fill: new Fill({ color: "#ffffff", }), offsetX: 0, }), }); },});// 创建绘制工具const dragBox = new DragBox({ condition: always,});// 开始绘制,清除已有要素dragBox.on("boxstart", function () { select.getFeatures().clear();});// 结束绘制dragBox.on("boxend", function () { // 获取被选择的要素 const extent = dragBox.getGeometry().getExtent(); vectorLayer .getSource() .forEachFeatureIntersectingExtent(extent, function (feature) { select.getFeatures().push(feature); }); // 遍历被选中的要素 const selected = []; const selectedFeatures = select.getFeatures(); for (let i = 0; i < selectedFeatures.getLength(); i++) { const feature = selectedFeatures.item(i); const name = feature.get("name"); selected.push(name); } // 输出查询结果 const msg = selected.join("、"); document.getElementById("msg").innerText = "被选中的要素:" + msg;});// 监听地图的点击事件,点击时清除框选map.on("singleclick", function () { select.getFeatures().clear(); document.getElementById("msg").innerText = "";});// 添加交互工具map.addInteraction(dragBox);map.addInteraction(select);
类似资料:
-
OpenLayers 是一个高性能、功能丰富的库,用于在 Web 上创建交互式地图。它可以显示从任何来源加载的地图图块、矢量数据和标记。
-
主要介绍 SuperMap iClient for OpenLayers 的入门用法,详细的接口参数请参考 API 页面
-
返回这样的定位坐标,但是在地上是定位不对
-
openlayers的api里面都找不到wcs相关的,有大佬知道怎么调吗?
-
OpenLayers 是一个专为 Web GIS 客户端开发提供的 JavaScript 类库包,用于实现标准格式发布的地图数据访问。
-
问题内容: 我有一个按照以下示例结构的mysql表: 现在我想做的是创建一个查询,该查询将在搜索位置的选定公里内选择结果 因此,假设他们搜索“灰色河流”,然后选择“在20公里以内找到所有结果” 它显然应该选择“灰河”,但也应根据经度和纬度选择灰河20公里以内的所有位置。 我真的不知道该怎么做。我已经读过haversine公式,但不知道如何将其应用于mysql SELECT。 任何帮助将非常感激。

