可视化 - 如何配置MarkLine文字标签的位置,可以配置显示在线起点、终点或者线段中间?
类似 (https://www.visactor.io/vchart/demo/marker/mark-line-basic)这样的使用了markLine做轴空间定位的图表,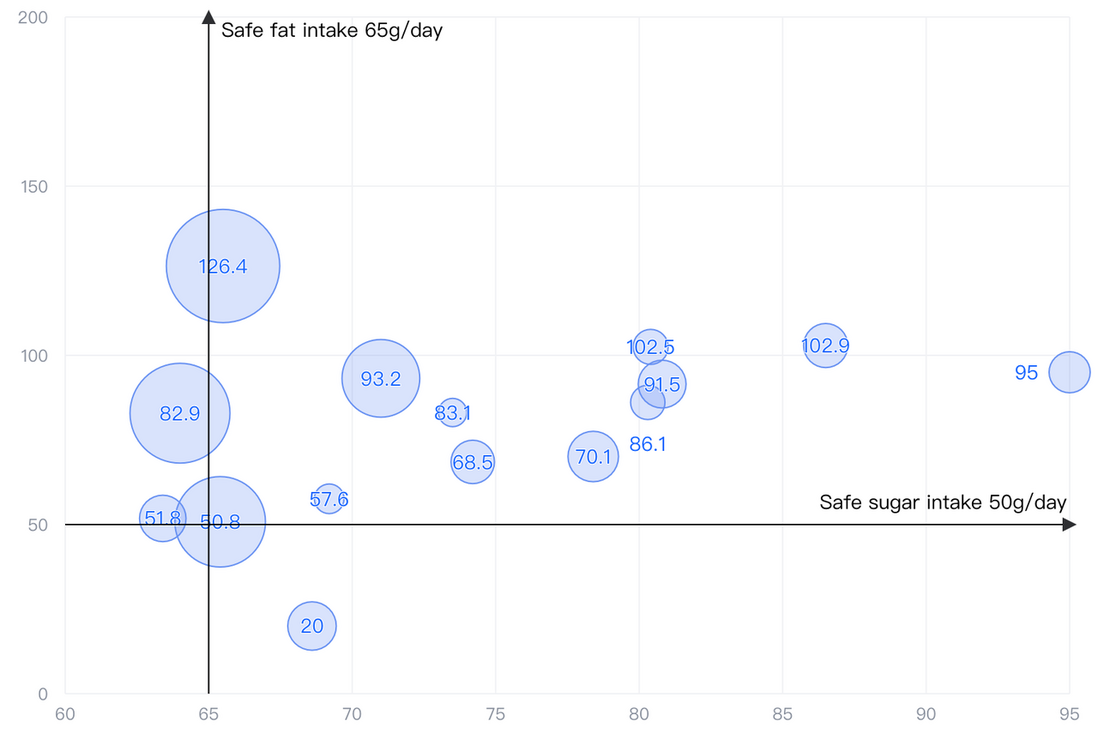
想要实现markLine中的label显示在线的起点、线的终点或者线段中间,该如何实现?
共有1个答案
解决方案 Solution
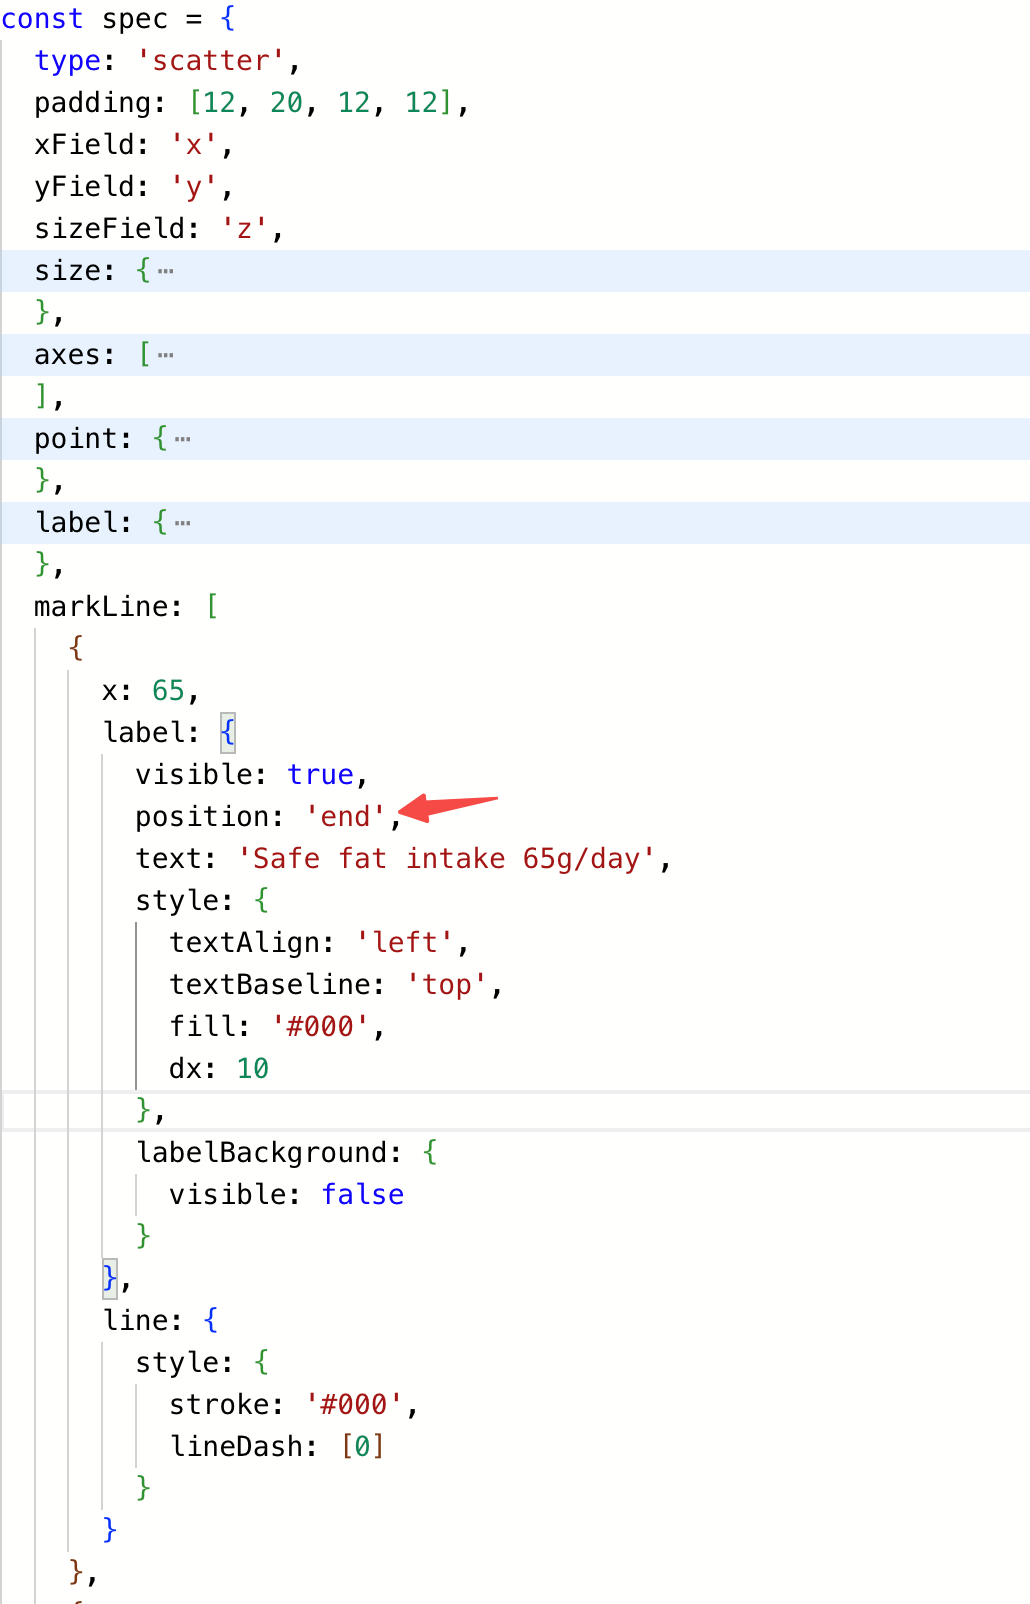
不同图表库的解决方案不一样,根据你给的demo,只需要将配置markLine.label.`position` 为所需场景。
markLine.label.`position` 用来配置标注线的标签位置(标签相对线的相对位置)。- 当文字标签显示在线的起点时,可配置
position为'start' - 当文字标签显示在线的终点时,可配置
position为'end' - 当文字标签显示在线段中间时,可配置
position为'middle'
- 当文字标签显示在线的起点时,可配置
代码示例 Code Example
代码参考 Code Example
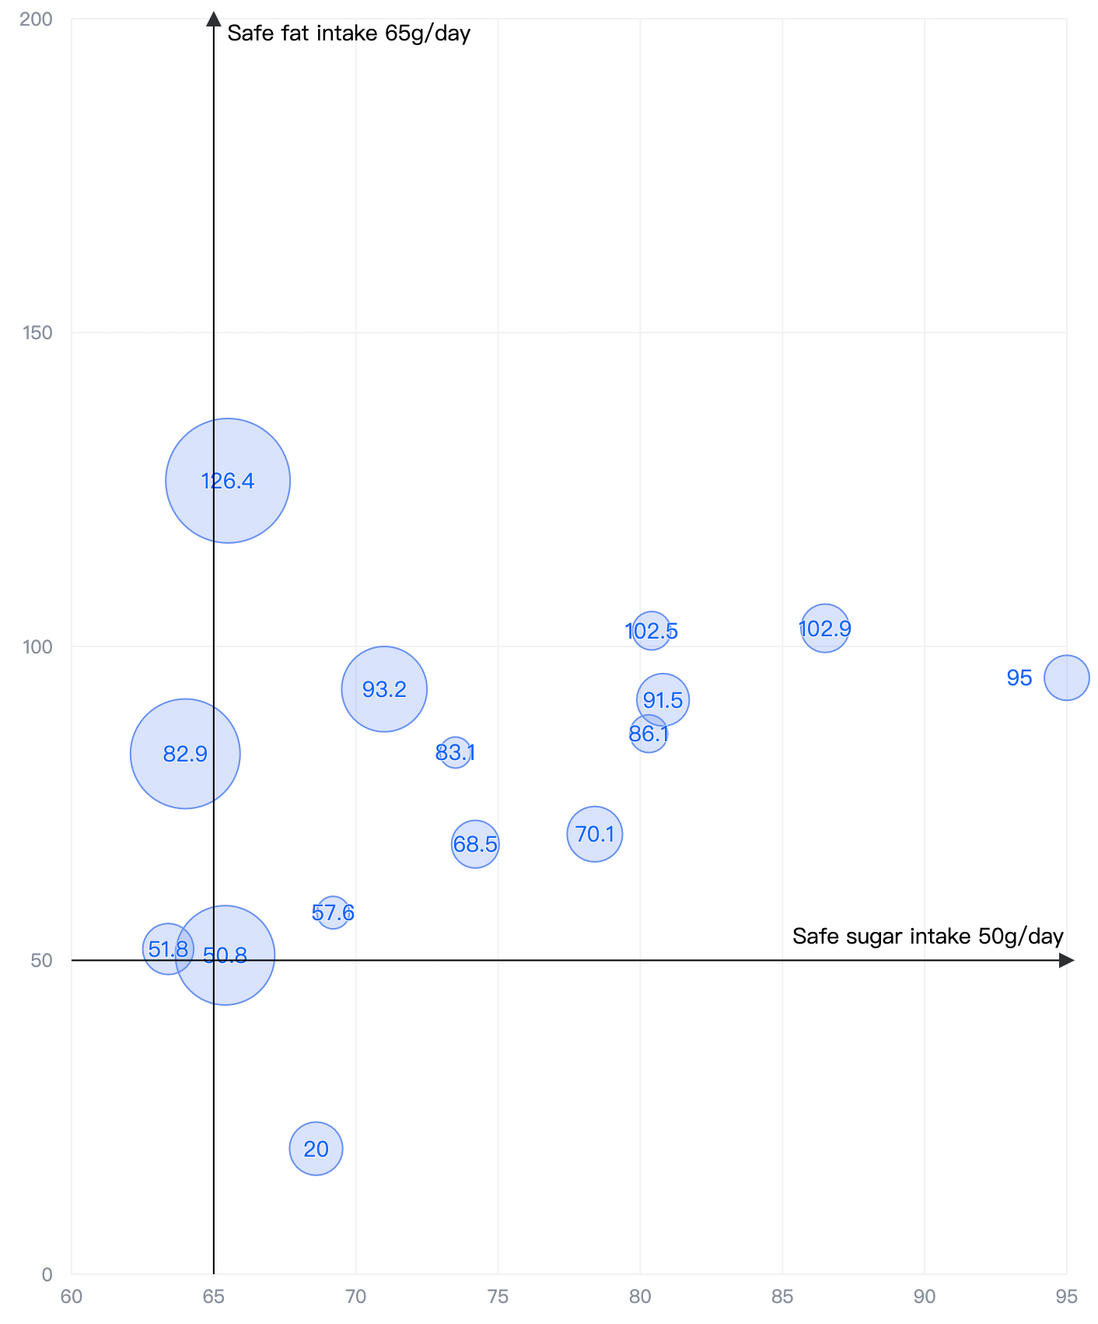
const spec = { type: 'scatter', padding: [12, 20, 12, 12], xField: 'x', yField: 'y', sizeField: 'z', size: { type: 'linear', range: [20, 80] }, axes: [ { orient: 'bottom', type: 'linear', min: 60, max: 95 }, { orient: 'left', type: 'linear', min: 0, max: 200 } ], point: { style: { fillOpacity: 0.25, lineWidth: 1, stroke: '#6690F2', fill: '#6690F2' } }, label: { visible: true, position: 'center', overlap: { avoidBaseMark: false }, style: { stroke: '#fff', lineWidth: 1 } }, markLine: [ { x: 65, label: { visible: true, position: 'end', text: 'Safe fat intake 65g/day', style: { textAlign: 'left', textBaseline: 'top', fill: '#000', dx: 10 }, labelBackground: { visible: false } }, line: { style: { stroke: '#000', lineDash: [0] } } }, { y: 50, label: { visible: true, position: 'end', text: 'Safe sugar intake 50g/day', style: { textAlign: 'right', textBaseline: 'bottom', fill: '#000' }, labelBackground: { visible: false } }, line: { style: { stroke: '#000', lineDash: [0] } } } ], tooltip: { mark: { title: { value: datum => datum.country } } }, data: { id: 'data', values: [ { x: 95, y: 95, z: 13.8, name: 'BE', country: 'Belgium' }, { x: 86.5, y: 102.9, z: 14.7, name: 'DE', country: 'Germany' }, { x: 80.8, y: 91.5, z: 15.8, name: 'FI', country: 'Finland' }, { x: 80.4, y: 102.5, z: 12, name: 'NL', country: 'Netherlands' }, { x: 80.3, y: 86.1, z: 11.8, name: 'SE', country: 'Sweden' }, { x: 78.4, y: 70.1, z: 16.6, name: 'ES', country: 'Spain' }, { x: 74.2, y: 68.5, z: 14.5, name: 'FR', country: 'France' }, { x: 73.5, y: 83.1, z: 10, name: 'NO', country: 'Norway' }, { x: 71, y: 93.2, z: 24.7, name: 'UK', country: 'United Kingdom' }, { x: 69.2, y: 57.6, z: 10.4, name: 'IT', country: 'Italy' }, { x: 68.6, y: 20, z: 16, name: 'RU', country: 'Russia' }, { x: 65.5, y: 126.4, z: 35.3, name: 'US', country: 'United States' }, { x: 65.4, y: 50.8, z: 28.5, name: 'HU', country: 'Hungary' }, { x: 63.4, y: 51.8, z: 15.4, name: 'PT', country: 'Portugal' }, { x: 64, y: 82.9, z: 31.3, name: 'NZ', country: 'New Zealand' } ] }};结果展示 Results
在线效果参考:https://codesandbox.io/s/mark-line-basic-srhwq3
position: "start":
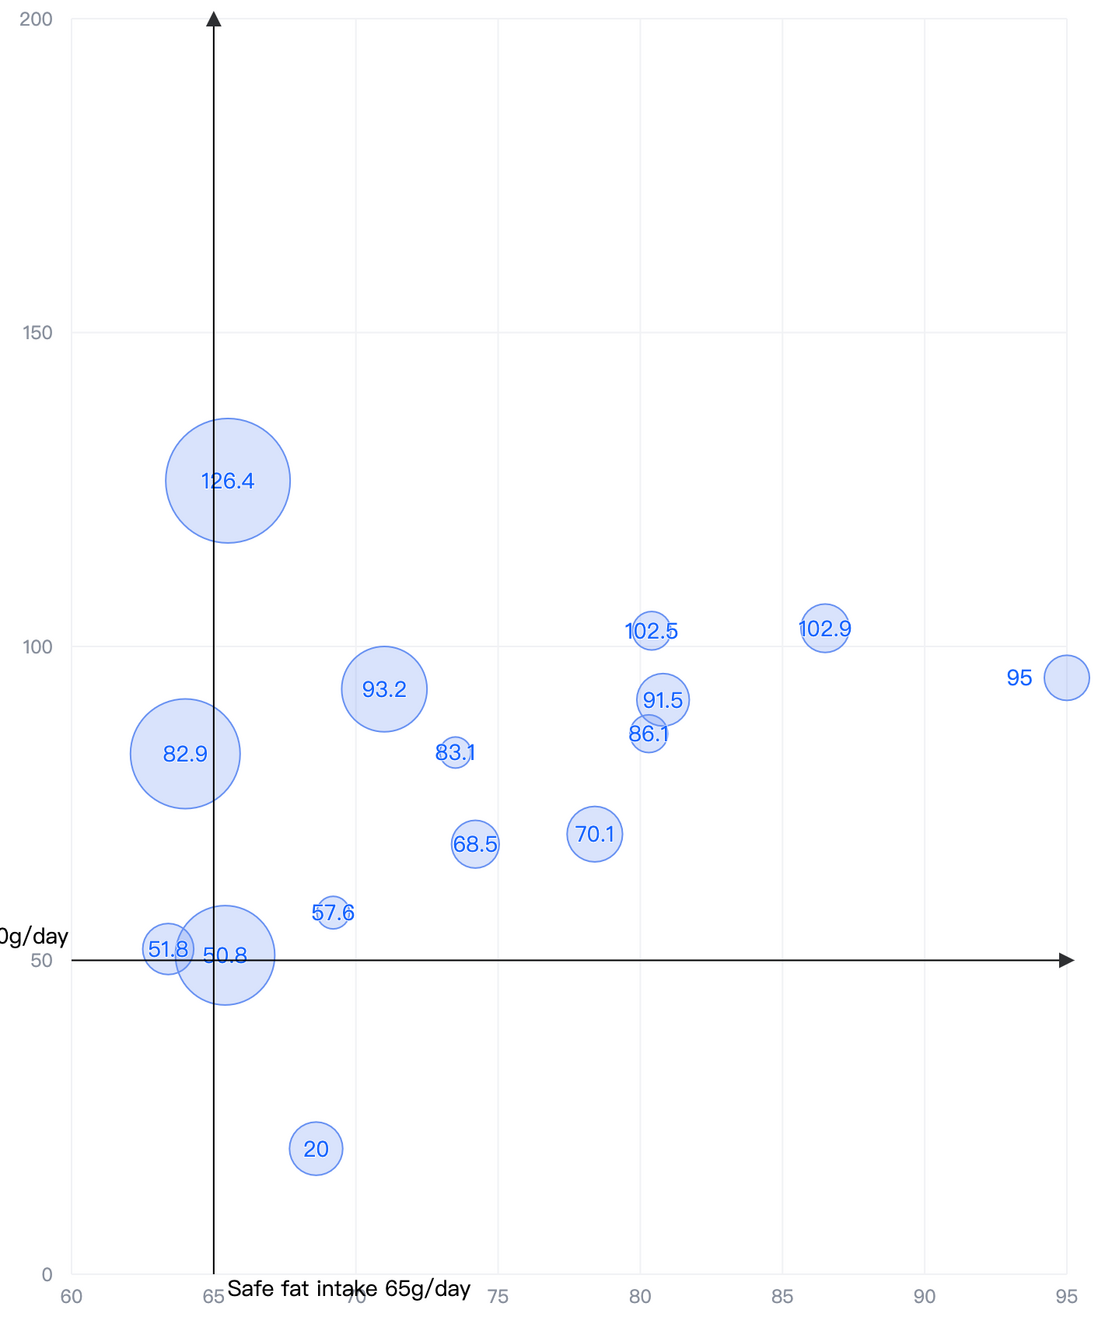
position: "middle":
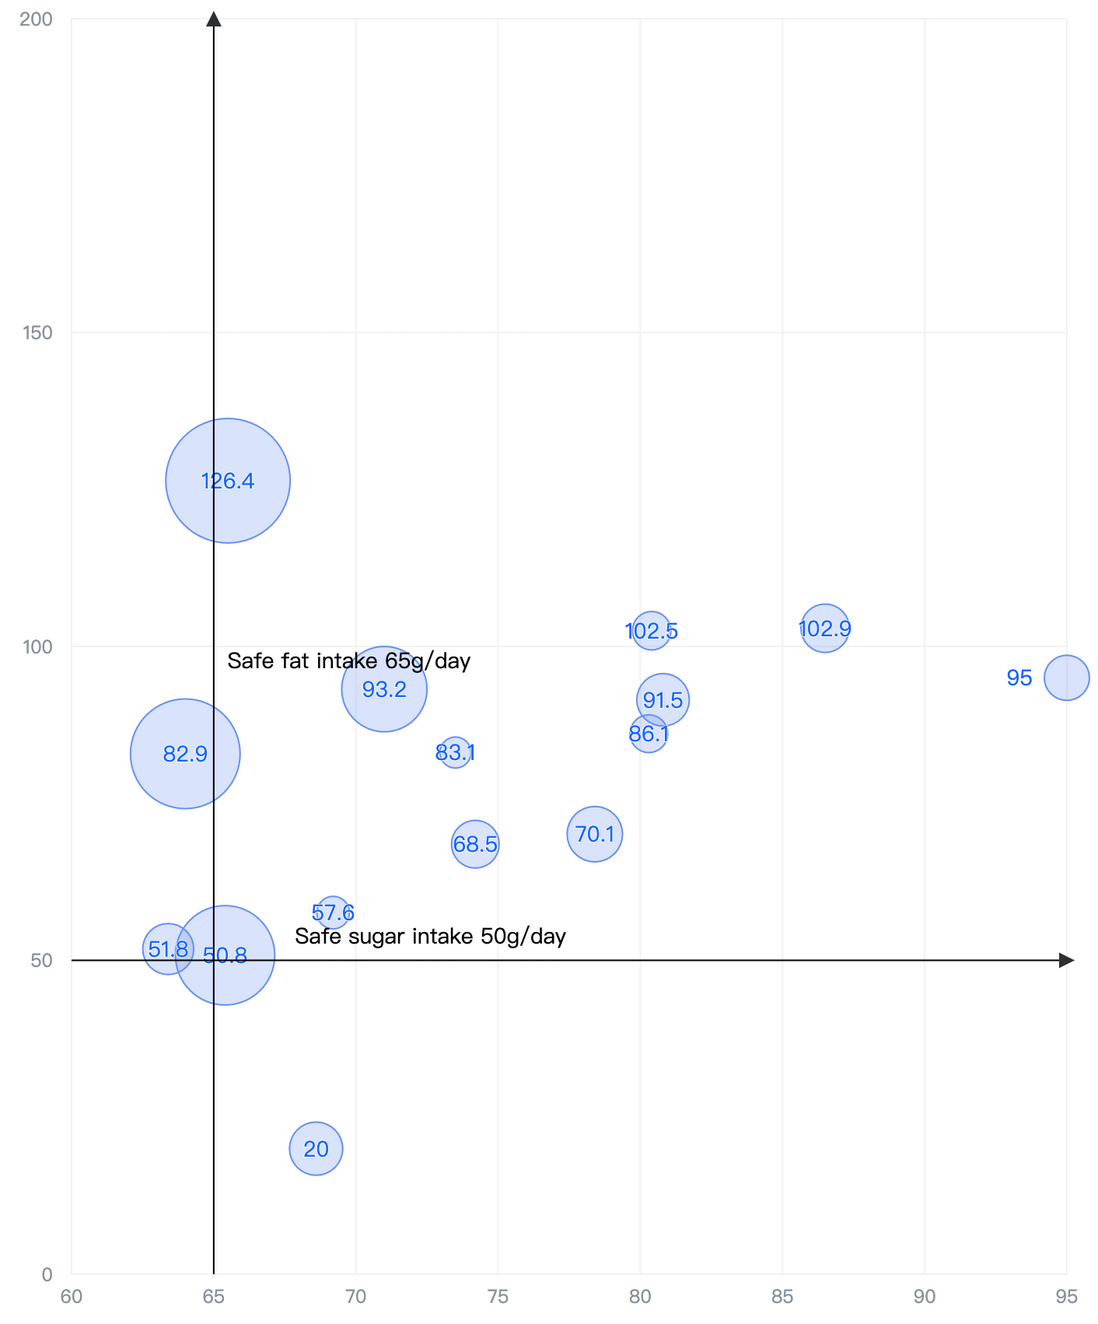
position: "end":
相关文档 Related Documentation
markLine demo:https://www.visactor.io/vchart/demo/marker/mark-line-basic
markLine教程:https://www.visactor.io/vchart/guide/tutorial_docs/Chart_Conc...
相关api:https://www.visactor.io/vchart/option/barChart#markLine.label...
github:https://github.com/VisActor/VChart
-
概述 使用可视化圈选功能,需要集成“应用分析(无埋点)”类型的SDK。 可视化圈选事件是移动统计对现有的埋点功能的升级。通过在网页上圈选App内的对应控件,达到收集APP对应的控件(如按钮)的点击事件的效果。 建议您使用可视化圈选方式进行事件埋点,不需要使用手动埋点。 版本支持 支持系统iOS 8.0+。 集成步骤 下载并集成MTJ最新版的“应用分析(无埋点)”类型的SDK,您可以前往SDK中心下
-
Android 可视化圈选接入 SDK(即应用分析无埋点SDK)简介 百度移动统计无埋点SDK是在现有的手动埋点SDK上的一个功能升级。结合了所有手动埋点的优势,同时避免了手动埋点的繁琐过程。实现了一行代码接入,配合WEB端圈选,完成页面和事件统计功能。 百度移动统计无埋点SDK兼容现有代码埋点SDK,API完全兼容支持。 版本支持 无埋点SDK支持 android 4.0 及之上(api lev
-
在项目设置(文件- 点击下载Android NDK简短地显示一些对话框。安装了几个版本的NDK: 我的设置有什么问题? 主机:Ubuntu 18.04 LTS Android Studio 4.1.1构建#AI-201.8743.12.41.6953283,构建于2020年11月5日运行时版本: 1.8.0_242-发布-1644-b3-6222593 amd64 VM: OpenJDK 64位服
-
类似 (https://www.visactor.io/vchart/demo/line-chart/basic-line)这样的数据全为0的折线图, x轴的位置会使折线居中。想要调整X轴的位置,使X轴与Y刻度为0对齐,该如何实现?
-
问题内容: 我正在运行运行移动鼠标并单击()的测试。为了改善调试和查看体验,我想查看鼠标光标当前所在的位置。使用上述方法不会移动系统鼠标光标。 问题答案: 在每个页面加载后执行javascript,以启用鼠标光标显示。 这取决于目标页面中加载的JQuery beeing-也可以使用没有精美动画的另一种解决方案。
-
我有一个UBUNTU/APACHE框,当我尝试使用主机名访问web服务器时,它会将我带到DocumentRoot(即/var/www),并显示那里的所有文件/文件夹(如预期的那样)。 在我的 /var/www我有几个文件夹,如 /var/www/devel和var/www/live,我如何更新我的配置,以便当我通过它的主机名[超文本传输协议://servername]击中服务器时,它会进入默认情况

