
D3工具提示未出现在鼠标附近

我希望鼠标悬停在节点上时,工具提示显示在鼠标旁边。我尝试了我在上找到的解决方案,但到目前为止,只有Boxun的解决方案起到了作用,尽管这并不是我想要的(D3.js:使用元素位置来定位工具提示,而不是鼠标位置?)。
我想知道为什么在我的听众功能中,
.on('mousemove', function(d) {})
,功能
Tooltips
.style("left", d3.mouse(this)[0])
.style("top", (d3.mouse(this)[1]))
或者
Tooltips
.style("left", d3.event.pageX + 'px')
.style("top", d3.event.pageY + 'px')
显示在svg的顶部,而不是鼠标所在的位置。
通过阅读上面链接的答案,我认为我必须以某种方式转换坐标,但我无法使其工作。
import * as d3_base from "d3";
import * as d3_dag from "d3-dag";
const d3 = Object.assign({}, d3_base, d3_dag);
drawDAG({
graph: [
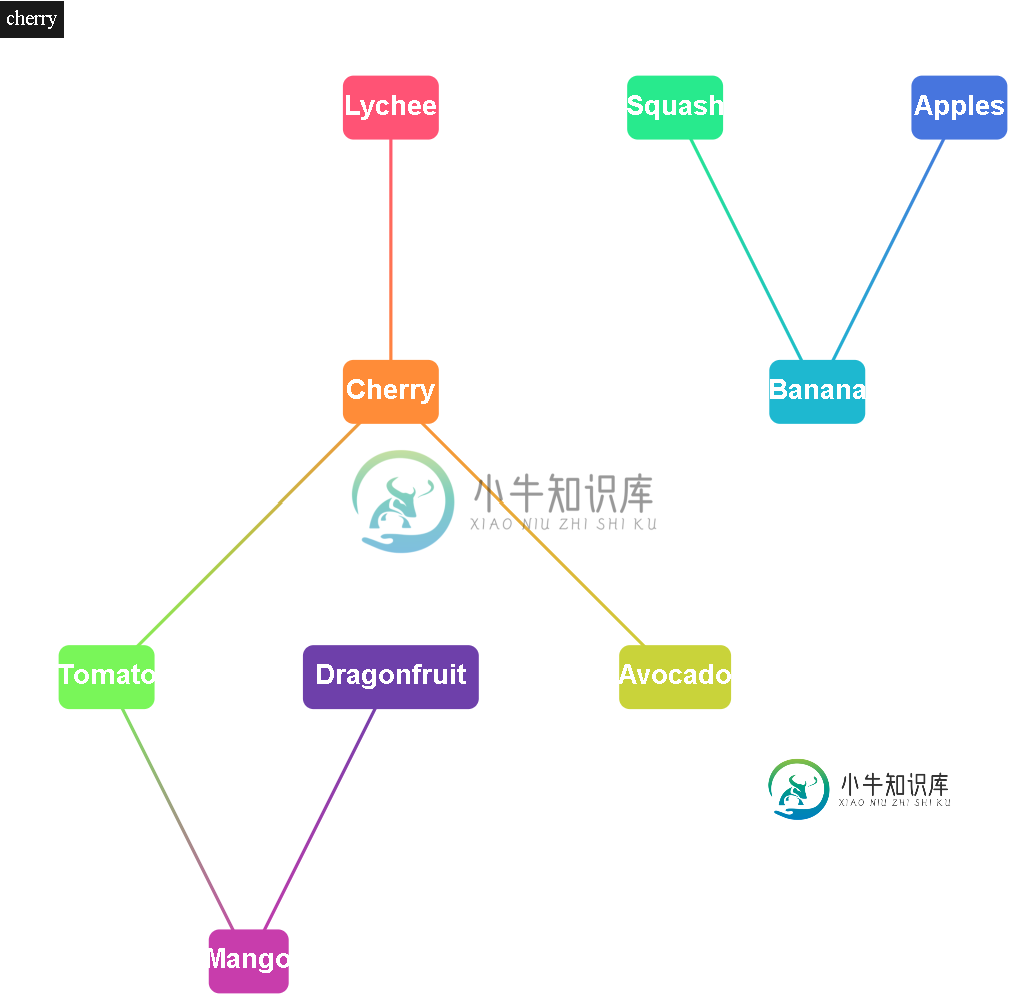
["apples", "banana"],
["cherry", "tomato"],
["cherry", "avocado"],
["squash", "banana"],
["lychee", "cherry"],
["dragonfruit", "mango"],
["tomato", "mango"]
]
})
async function drawDAG(response) {
loadDag(response['graph'])
.then(layoutAndDraw())
.catch(console.error.bind(console));
}
async function loadDag(source) {
const [key, reader] = ["zherebko", d3_dag.dagConnect().linkData(() => ({}))]
return reader(source);
}
function layoutAndDraw() {
const width = 800;
const height = 800;
const d3 = Object.assign({}, d3_base, d3_dag);
function sugiyama(dag) {
const layout = d3.sugiyama()
.size([width, height])
.layering(d3.layeringSimplex())
.decross(d3.decrossOpt())
.coord(d3.coordVert());
layout(dag);
draw(dag);
}
return sugiyama;
function draw(dag) {
// Create a tooltip
const Tooltip = d3.select("root")
.append("div")
.attr("class", "tooltip")
.style('position', 'absolute')
.style("opacity", 0)
.style("background-color", "black")
.style("padding", "5px")
.style('text-align', 'center')
.style('width', 60)
.style('height', 30)
.style('border-radius', 10)
.style('color', 'white')
// This code only handles rendering
const nodeRadius = 100;
const svgSelection = d3.select("root")
.append("svg")
.attr("width", width)
.attr("height", height)
.attr("viewBox", `${-nodeRadius} ${-nodeRadius} ${width + 2 * nodeRadius} ${height + 2 * nodeRadius}`);
const defs = svgSelection.append('defs');
const steps = dag.size();
const interp = d3.interpolateRainbow;
const colorMap = {};
dag.each((node, i) => {
colorMap[node.id] = interp(i / steps);
});
// How to draw edges
const line = d3.line()
.curve(d3.curveCatmullRom)
.x(d => d.x)
.y(d => d.y);
// Plot edges
svgSelection.append('g')
.selectAll('path')
.data(dag.links())
.enter()
.append('path')
.attr('d', ({
data
}) => line(data.points))
.attr('fill', 'none')
.attr('stroke-width', 3)
.attr('stroke', ({
source,
target
}) => {
const gradId = `${source.id}-${target.id}`;
const grad = defs.append('linearGradient')
.attr('id', gradId)
.attr('gradientUnits', 'userSpaceOnUse')
.attr('x1', source.x)
.attr('x2', target.x)
.attr('y1', source.y)
.attr('y2', target.y);
grad.append('stop').attr('offset', '0%').attr('stop-color', colorMap[source.id]);
grad.append('stop').attr('offset', '100%').attr('stop-color', colorMap[target.id]);
return `url(#${gradId})`;
});
// Select nodes
const nodes = svgSelection.append('g')
.selectAll('g')
.data(dag.descendants())
.enter()
.append('g')
.attr('width', 100)
.attr('height', 100)
.attr('transform', ({
x,
y
}) => `translate(${x}, ${y})`)
.on('mouseover', function(d) {
Tooltip
.style('opacity', .8)
.text(d.id)
})
.on('mouseout', function(d) {
Tooltip
.style('opacity', 0)
})
.on('mousemove', function(d) {
var matrix = this.getScreenCTM()
.translate(+this.getAttribute("cx"), +this.getAttribute("cy"));
Tooltip
.html(d.id)
.style("left", (window.pageXOffset + matrix.e - 50) + "px")
.style("top", (window.pageYOffset + matrix.f - 60) + "px");
})
// Plot node circles
nodes.append('rect')
.attr('y', -30)
.attr('x', (d) => {
return -(d.id.length * 15 / 2)
})
.attr('rx', 10)
.attr('ry', 10)
.attr('width', (d) => {
return d.id.length * 15;
})
.attr('height', (d) => 60)
.attr('fill', n => colorMap[n.id])
// Add text to nodes
nodes.append('text')
.text(d => {
let id = '';
d.id.replace(/_/g, ' ').split(' ').forEach(str => {
if (str !== 'qb')
id += str.charAt(0).toUpperCase() + str.substring(1) + '\n';
});
return id;
})
.attr('font-size', 25)
.attr('font-weight', 'bold')
.attr('font-family', 'sans-serif')
.attr('text-anchor', 'middle')
.attr('alignment-baseline', 'middle')
.attr('fill', 'white')
.attr();
}
}共有1个答案

您可以尝试使用这个,这将确保工具提示显示在鼠标的确切位置。
d3.event.offsetY
-
我想用鼠标在表格中的图像上显示工具提示。请找到小提琴样品http://jsfiddle.net/FpBu4/42/我想用鼠标在图像的右上方显示工具提示。下面是示例脚本: 请建议如何在图像上的鼠标上显示图像附近的工具提示。谢谢
-
我在使用mousemove事件显示工具提示时遇到了一些麻烦。基本上,当我的鼠标指针在图片框的某些区域上时,我想显示一个工具提示。我试图使用mousemove事件来完成此操作,确定阉羊指针位于最佳位置,并(如果是这样)使用settools tip设置工具提示。 这是我的mousemove事件(我注意到,当显示工具提示时,mousemove会持续触发,我会检查位置是否真的发生了变化) 这工作正常,除了
-
我正在用chart.js实现一些点图。没有问题,但我想做的是有一个工具提示,不只是附加到给定的数据点。现在,您可以创建一个工具提示,它将在图表上给定数据点附近显示一个弹出窗口。例如,如果我有数据点[1,5]、[2,6]和[3,7],它将很高兴地显示这三个数据点。 但我想要的是,当我在1,5到2,6之间时,看看我在x轴上的确切位置。1.5,1.6等。 但这是x和y在画布上的位置,与实际的x和y图形坐
-
我通过为标题创建
-
我用D3画了一个散点图。我想在用户将鼠标移到每个圆上时显示工具提示。 我的问题是我可以附加工具提示,但它们是使用鼠标事件,因此它们在每个圆上的位置不一致。 取而代之的是,有些稍微偏左,有些偏右——这取决于用户的鼠标如何进入圆圈。 这是我的代码: JSFiddle是否显示了问题:http://jsfiddle.net/WLYUY/5/ 是否有某种方法可以使用圆心本身作为定位工具提示的位置,而不是鼠标
-
我在我的类的构造函数中使用了这段代码。 当鼠标进入时,println语句会打印到控制台,但其他两个工具提示方法不会显示相关的工具提示。这里的combobox是swing combobox的一个实例字段。settooltip方法不显示工具提示的原因是什么?