
使用mayavi绘制三维网络时删除节点

我使用Networkx创建了一个图形网络,并使用Mayavi绘制。
创建图形后,我将删除具有度的节点
import matplotlib.pyplot as plt
from mayavi import mlab
import numpy as np
import pandas as pd
pos = [[0.1, 2, 0.3], [40, 0.5, -10],
[0.1, -40, 0.3], [-49, 0.1, 2],
[10.3, 0.3, 0.4], [-109, 0.3, 0.4]]
pos = pd.DataFrame(pos, columns=['x', 'y', 'z'])
ed_ls = [(x, y) for x, y in zip(range(0, 5), range(1, 6))]
G = nx.Graph()
G.add_edges_from(ed_ls)
remove = [node for node, degree in dict(G.degree()).items() if degree < 2]
G.remove_nodes_from(remove)
pos.drop(pos.index[remove], inplace=True)
print(G.edges)
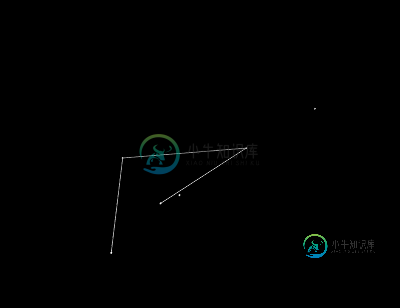
nx.draw(G)
plt.show()
mlab.figure(1, bgcolor=bgcolor)
mlab.clf()
for i, e in enumerate(G.edges()):
# ----------------------------------------------------------------------------
# the x,y, and z co-ordinates are here
pts = mlab.points3d(pos['x'], pos['y'], pos['z'],
scale_mode='none',
scale_factor=1)
# ----------------------------------------------------------------------------
pts.mlab_source.dataset.lines = np.array(G.edges())
tube = mlab.pipeline.tube(pts, tube_radius=edge_size)
mlab.pipeline.surface(tube, color=edge_color)
mlab.show() # interactive window
我想询问有关如何删除删除的节点和相应位置并在输出中显示其余节点的建议。
其次,我想知道如何以交互方式删除节点和连接到这些节点的边。例如,如果要删除连接到度节点的节点和边
编辑:我试图从数据帧pos中删除已删除节点的位置,方法是在上面发布的完整代码中包含pos.drop(pos.index[删除], inplace=True)更新。
但我仍然没有得到正确的输出。

共有1个答案

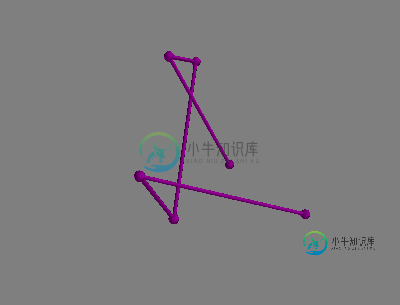
这是一个在Mayavi中交互式删除网络节点和边缘的解决方案(我认为matplotlib可能足够简单,但无论如何……)。
该解决方案的灵感来自此Mayavi示例。但是,由于图示符(用于显示节点)由多个点组成,因此该示例不能直接传递,并且在单独绘制每个图示符/节点时,不能使用点id来识别图示符/节点。此外,它不包括隐藏/删除对象的选项。为了避免这些问题,我使用了四个想法:
>
每个节点/边缘都被绘制为一个单独的对象,因此更容易调整它的(可见性)属性。
单击节点/边时,它们将隐藏,而不是删除节点/边。此外,单击两次会使节点再次可见(这对下面代码的边不起作用,但如果需要,您可能可以实现这一点,只需要跟踪可见节点)。可以在末尾收集可见节点(请参见下面的代码)。
如示例中所示,使用选择器回调捕获鼠标位置。但不是使用最近点的点id,而是直接使用其坐标。
通过计算鼠标位置与所有节点之间的最小欧氏距离,找到要删除/隐藏的节点。
PS:在您的原始代码中,forhtml" target="_blank">循环是非常冗余的,因为它多次将所有节点和边绘制在彼此的顶部。
希望这有帮助!
# import modules
from mayavi import mlab
import numpy as np
import pandas as pd
import networkx as nx

# set number of nodes
number = 6

# create random node positions
np.random.seed(5)
pos = 100*np.random.rand(6, 3)
pos = pd.DataFrame(pos, columns=['x', 'y', 'z'])

# create chain graph links
links = [(x, y) for x, y in zip(range(0, number-1), range(1, number))]

# create graph (not strictly needed, link list above would be enough)
graph = nx.Graph()
graph.add_edges_from(links)

# setup mayavi figure
figure = mlab.gcf()
mlab.clf()

# add nodes as individual glyphs
# store glyphs in dictionary to allow interactive adjustments of visibility
color = (0.5, 0.0, 0.5)
nodes = dict()
texts = dict()
for ni, n in enumerate(graph.nodes()):
    xyz = pos.loc[n]
    n = mlab.points3d(xyz['x'], xyz['y'], xyz['z'], scale_factor=5, color=color)
    label = 'node %s' % ni
    t = mlab.text3d(xyz['x'], xyz['y'], xyz['z']+5, label, scale=(5, 5, 5))
    # each glyph consists of many points
    # arr = n.glyph.glyph_source.glyph_source.output.points.to_array()
    nodes[ni] = n
    texts[ni] = t

# add edges as individual tubes
edges = dict()
for ei, e in enumerate(graph.edges()):
    xyz = pos.loc[np.array(e)]
    edges[ei] = mlab.plot3d(xyz['x'], xyz['y'], xyz['z'], tube_radius=1, color=color)


# define picker callback for figure interaction
def picker_callback(picker):
    # get coordinates of mouse click position
    cen = picker.pick_position
    # compute Euclidean distance btween mouse position and all nodes
    dist = np.linalg.norm(pos-cen, axis=1)
    # get closest node
    ni = np.argmin(dist)
    # hide/show node and text
    n = nodes[ni]
    n.visible = not n.visible
    t = texts[ni]
    t.visible = not t.visible
    # hide/show edges
    # must be adjusted if double-clicking should hide/show both nodes and edges in a reasonable way
    for ei, edge in enumerate(graph.edges()):
        if ni in edge:
            e = edges[ei]
            e.visible = not e.visible


# add picker callback
picker = figure.on_mouse_pick(picker_callback)
picker.tolerance = 0.01

# show interactive window
# mlab.show()

# collect visibility/deletion status of nodes, e.g.
# [(0, True), (1, False), (2, True), (3, True), (4, True), (5, True)]
[(key, node.visible) for key, node in nodes.items()]
-
字节网络运维 一面不怎么问我路由交换,全问报文字段,我说你为啥不问rs,他说可能是因为一面的原因 二面继续问报文,问的问题基本没答上来,然后让我编程写排序算法,写完我在那debug,他不耐烦给我说,时间不够了,你自己下去debug吧。面了就40分钟,被拷打惨了
-
问题内容: 我正在尝试制作粒子轨迹的视频。但是,我的场景以某种方式从未更新过。这是一个非常简单的示例: 如果运行此脚本,它将显示一个包含两个点和动画GUI的窗口。它还在终端上打印连续的“正在更新场景…”消息流。但是,场景根本不显示任何运动。 我究竟做错了什么? Python 2.7,Mayavi 4.1,VTK 5.8 问题答案: 只需更改为: … … 您甚至不需要,根据说明文件,可以 保证刷新。
-
本文向大家介绍删除Docker网络,包括了删除Docker网络的使用技巧和注意事项,需要的朋友参考一下 示例 该命令app-backend从Docker主机中删除用户定义的网络。网络上所有未通过其他网络连接的容器将失去与其他容器的通信。无法删除默认的桥接bridge网络,host主机网络或null空网络。
-
1、自我介绍 2、TCP/IP 与 OSI区别 3、各层之间如何实现差错控制 4、IPv4和IPv6在协议 设计上的不同 5、IPv6在电脑网卡上有几个地址,什么开头 6、问课程,为什么使用分层架构 7、路由汇总会带来什么问题 8、堆和栈区别 9、程序设计 python c++ 10、是否读研、工作地点倾向 反问 1、团队架构 2、多数据中心如何协同 问的都是底层知识,得好好复习计算机网络和数据结
-
编辑我试图找出我的代码有什么问题,我开始绘制简单的图形,看看箭头在较小的图形上会是什么样子。我听到以下命令: 我试图生成一个网络的情节,出于某种原因,我的箭头看起来像小矩形,而不是通常的三角形箭头。 以下是我用于绘图的代码: 下面是一个示例图: 当我为。 我的代码有什么问题?这可能与R的版本有关吗?我以前用非常类似的命令绘制了很多图,我从来没有遇到过问题。 这里是带有节点信息和边缘列表的文件。
-
我有一个三维阵列。列的标题是“身高”、“体重”和“年龄”。如何使用或任何其他可用功能绘制三维直方图? 我从这段代码开始,但后来我陷入了如何绘制三维直方图的困境。谢谢你宝贵的时间