
在Spring Boot Camel应用程序公开的Micrometer/Prometheus信息中包含额外的JMX度量

我已经用Camel 3.9配置了一个Spring Boot2应用程序,以便通过Actuator/Prometheusendpoint使用Micrometer公开度量标准,并正确返回一些Camel度量标准:
# HELP CamelExchangesFailed_total
# TYPE CamelExchangesFailed_total counter
CamelExchangesFailed_total{camelContext="camel-1",routeId="route3",serviceName="MicrometerRoutePolicyService",} 0.0
CamelExchangesFailed_total{camelContext="camel-1",routeId="route2",serviceName="MicrometerRoutePolicyService",} 0.0
CamelExchangesFailed_total{camelContext="camel-1",routeId="route1",serviceName="MicrometerRoutePolicyService",} 0.0
# HELP CamelExchangesTotal_total
# TYPE CamelExchangesTotal_total counter
CamelExchangesTotal_total{camelContext="camel-1",routeId="route3",serviceName="MicrometerRoutePolicyService",} 0.0
CamelExchangesTotal_total{camelContext="camel-1",routeId="route2",serviceName="MicrometerRoutePolicyService",} 0.0
CamelExchangesTotal_total{camelContext="camel-1",routeId="route1",serviceName="MicrometerRoutePolicyService",} 0.0
# HELP CamelExchangesExternalRedeliveries_total
# TYPE CamelExchangesExternalRedeliveries_total counter
CamelExchangesExternalRedeliveries_total{camelContext="camel-1",routeId="route3",serviceName="MicrometerRoutePolicyService",} 0.0
CamelExchangesExternalRedeliveries_total{camelContext="camel-1",routeId="route2",serviceName="MicrometerRoutePolicyService",} 0.0
CamelExchangesExternalRedeliveries_total{camelContext="camel-1",routeId="route1",serviceName="MicrometerRoutePolicyService",} 0.0
# HELP CamelExchangesSucceeded_total
# TYPE CamelExchangesSucceeded_total counter
CamelExchangesSucceeded_total{camelContext="camel-1",routeId="route3",serviceName="MicrometerRoutePolicyService",} 0.0
CamelExchangesSucceeded_total{camelContext="camel-1",routeId="route2",serviceName="MicrometerRoutePolicyService",} 0.0
CamelExchangesSucceeded_total{camelContext="camel-1",routeId="route1",serviceName="MicrometerRoutePolicyService",} 0.0
# HELP CamelExchangesFailuresHandled_total
# TYPE CamelExchangesFailuresHandled_total counter
CamelExchangesFailuresHandled_total{camelContext="camel-1",routeId="route3",serviceName="MicrometerRoutePolicyService",} 0.0
CamelExchangesFailuresHandled_total{camelContext="camel-1",routeId="route2",serviceName="MicrometerRoutePolicyService",} 0.0
CamelExchangesFailuresHandled_total{camelContext="camel-1",routeId="route1",serviceName="MicrometerRoutePolicyService",} 0.0
通过研究mbeans,我可以看到还有一些我也感兴趣的其他度量(例如,路由平均处理时间)
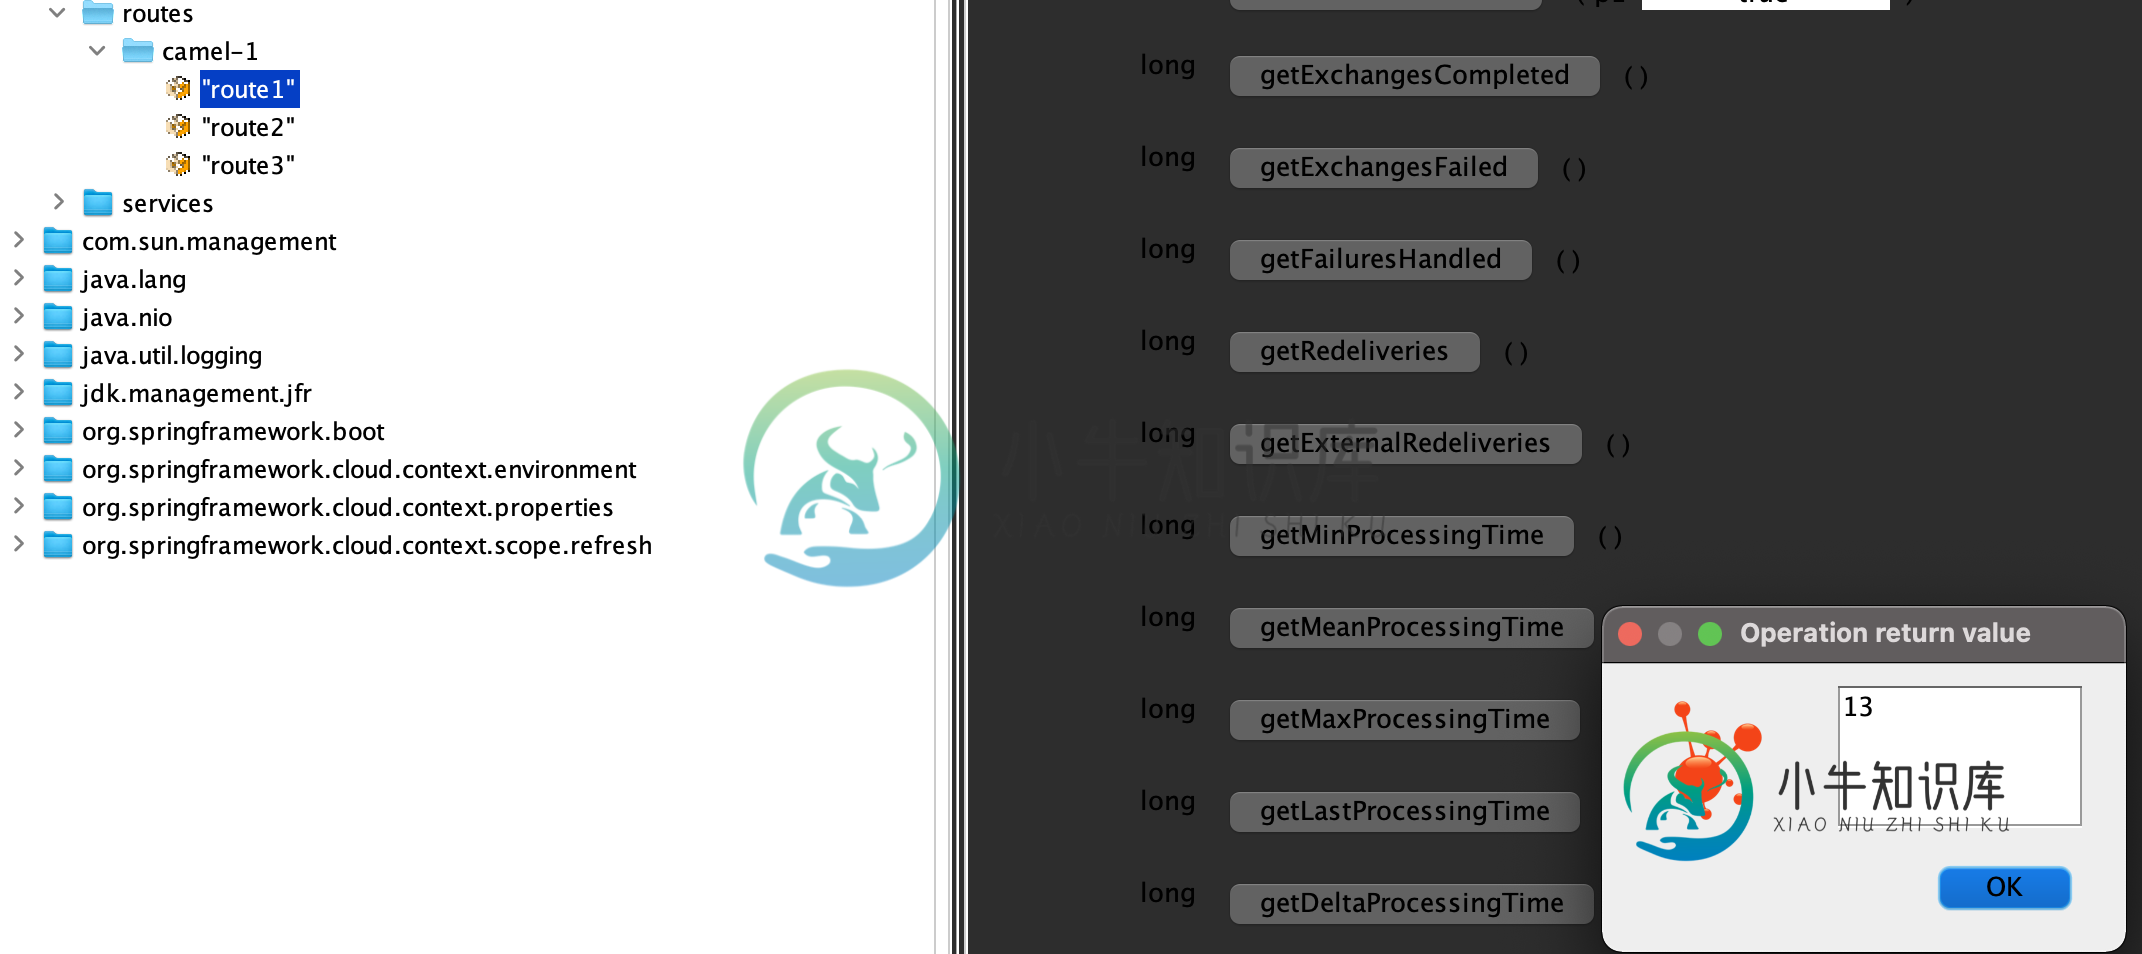
问题是,我如何使Spring靴执行器+千分尺+普罗米修斯包括那些额外的度量?
src/main/resources/config.yml

rules:
  - pattern: 'fis.metrics<name=os.(.*)><>(.+):'
    name: os_$1
    help: some help

  - pattern: 'org.apache.camel<context=camel, type=routes, name=\"(.*)\"><>LastProcessingTime'
    name: camel_last_processing_time
    help: Last Processing Time [milliseconds]
    type: GAUGE
    labels:
      route: $1
plugins {
    id "org.springframework.boot" version "2.4.4"
    id "com.github.lkishalmi.gatling" version "3.3.4"
}

apply plugin: 'eclipse'
apply plugin: 'com.github.lkishalmi.gatling'

description = """sle-sync"""

ext {
    springCloudVersion = '2020.0.2'
    orikaVersion = '1.5.2'
    junitVersion = '5.2.0'
    junitPlatformVersion = '1.2.0'
    camelVersion = '3.9.0'
}

repositories {
    mavenLocal()
}

dependencyManagement {
    imports {
        mavenBom "org.apache.camel.springboot:camel-spring-boot-bom:${camelVersion}"
        mavenBom "org.springframework.cloud:spring-cloud-dependencies:${springCloudVersion}"
    }
}

dependencies {
    implementation 'org.apache.camel.springboot:camel-spring-boot-starter',
            'org.apache.camel.springboot:camel-servlet-starter',
            'org.apache.camel.springboot:camel-http-starter',
            'org.apache.camel.springboot:camel-metrics-starter',
            "org.apache.camel.springboot:camel-micrometer-starter",
            'com.playtika.sleuth:sleuth-camel-core:2.1.0',
            "org.springframework.boot:spring-boot-starter-web",
            "org.springframework.boot:spring-boot-starter-actuator",
            "org.springframework.cloud:spring-cloud-starter-config",
            "org.springframework.cloud:spring-cloud-starter-kubernetes-fabric8-config",
            "org.springframework.cloud:spring-cloud-starter-sleuth",
            "io.micrometer:micrometer-registry-prometheus",
            "ma.glasnost.orika:orika-core:${orikaVersion}",
            'org.projectlombok:lombok',
            "jakarta.xml.bind:jakarta.xml.bind-api:2.3.2",
            "org.glassfish.jaxb:jaxb-runtime:2.3.2",
            'org.apache.camel:camel-management'
    testCompile 'org.apache.camel:camel-test-spring',
            "org.springframework.boot:spring-boot-starter-test",
            'com.github.sbrannen:spring-test-junit5:1.0.2',
            "org.junit.jupiter:junit-jupiter-api:${junitVersion}"
    testRuntimeOnly "org.junit.platform:junit-platform-launcher:${junitPlatformVersion}",
            "org.junit.jupiter:junit-jupiter-engine:${junitVersion}"
    annotationProcessor "org.projectlombok:lombok:1.18.10"
    testAnnotationProcessor "org.projectlombok:lombok:1.18.10"
}
CamelContextConfiguration:
    @Bean
    public CamelContextConfiguration camelContextConfiguration() {

        return new CamelContextConfiguration() {
            @Override
            public void beforeApplicationStart(CamelContext camelContext) {
                camelContext.addRoutePolicyFactory(new MicrometerRoutePolicyFactory());
                camelContext.setMessageHistoryFactory(new MicrometerMessageHistoryFactory());
            }

            @Override
            public void afterApplicationStart(CamelContext camelContext) {

            }
        };
    }
application.yml
camel:
  component:
    servlet:
      mapping:
        context-path: /api/*
    metrics:

      metric-registry: prometheusMeterRegistry


management:
  endpoints:
    web:
      exposure:
        include: info, health, prometheus
共有1个答案

如果有可以启用的内容,请先检查camel度量配置。如果Camel创建分发版或计时器,则可以启用千分尺端的百分位数报告。使用Spring Boot,检查management.metrics属性,例如:
management.metrics.distribution.percentiles.all=0.95, 0.98, 0.99, 0.999, 0.9999, 0.99999
management.metrics.distribution.percentiles-histogram.all=true
对于这个问题,Prometheus JMX Exporter可能是一个快速而肮脏的解决方案,但我不确定我是否会全心全意地推荐它:
- JVM代理使事情变得复杂,因为您需要将它添加到部署解决方案中
- JMX是分层的,Prometheus是多维的,所以您需要编写和维护正则表达式来进行转换(在那里,这不是一个非常愉快的练习)
- 如果要使用另一个后端,Prometheus JMX Exporter将无法与它们一起工作
-
关于如何构建CPU指标的可视化和洞察力的小问题。 我有一个Spring Boot Webflux应用程序,没什么特别的。我带来了执行器,千分尺和普罗米修斯依赖。 谢谢你。
-
是否可以在restendpoint中公开所有的Spring度量? 我使用的是spring Boot2.2.2并添加了这个依赖项 application.yml
-
我的Spring Boot应用程序只是有一个计数器指标。我只是不知道如何将这些信息发送给普罗米修斯。我正在使用Maven(构建工具)和Spring Boot(Java)。
-
问题内容: 在我可以公开服务。这可以。 可以说我有1个Web实例和10个Java服务器实例。 我有一个Windows网关,用于通过安装在其上的jconsole访问这10个Java服务器实例。 显然,我没有通过kubernetes服务公开所有应用程序的jmx端口。 我在这里有什么选择?我应该如何允许外部到kubernetes群集Windows网关访问这10个服务器的jmx端口?这里有什么做法吗? 问
-
所以我希望有人能帮我解决这个问题:) 谢谢
-
我已经和这件事斗争了一天多,在SO和其他地方读了很多帖子,但我仍然有问题。 我需要在一个自包含的JavaFX应用程序包中包含我的应用程序图标。我使用的是JDK1.8.0_45及其包含的JavaFX包。我正在使用Maven构建.exe,除了我不能包含我的图标外,它都运行得很好。 下面是我的pom.xml: 使图标出现在标题栏中的是javapackager部署步骤的参数。这一行告诉inno安装程序使用